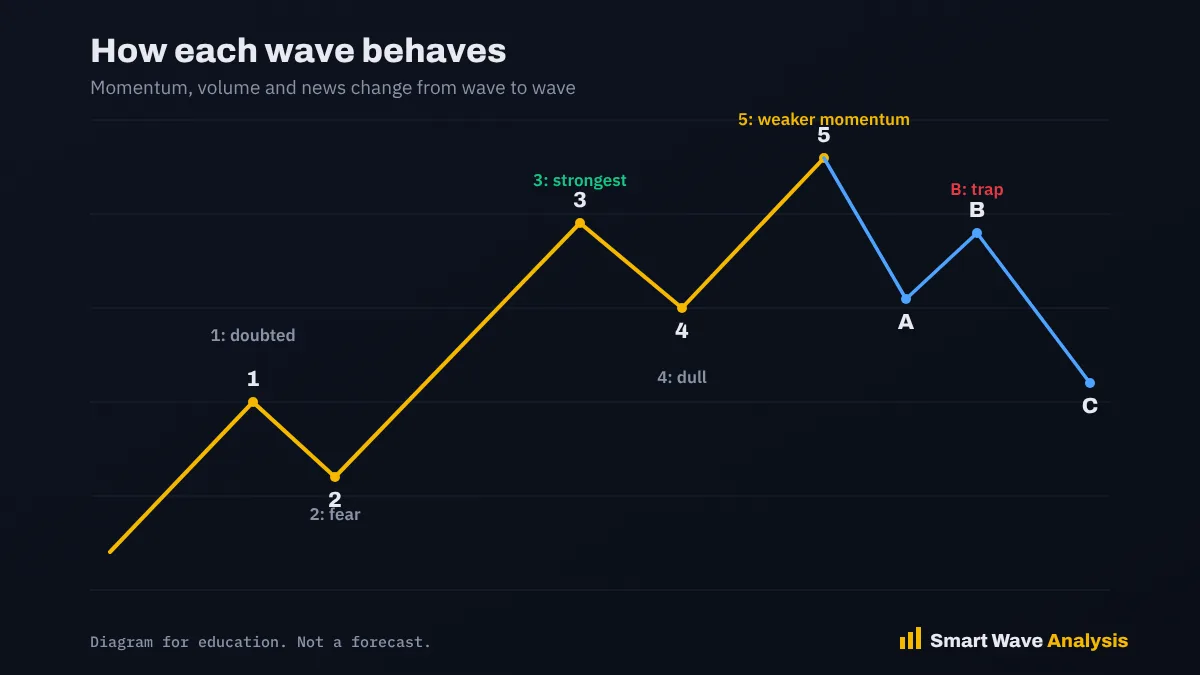
Each Elliott wave has a typical character. Wave 1 is doubted, wave 3 is powerful and broad, wave 5 often has weaker momentum, and wave B is a trap. Knowing these personalities helps you label waves correctly when the structure alone is unclear.
Why personality helps
Two moves can look the same on a chart but mean very different things. Wave personality, a term made popular by Frost and Prechter, looks at the mood, momentum and news around a wave. It helps you decide whether a move is a wave 3 or a wave C, or whether a rally is a new trend or just a wave B bounce.
Motive waves
Wave 1
Wave 1 starts when most people still expect the old trend to continue. News is usually bad in an uptrend that is just beginning. Many wave 1s look like a simple bounce, and volume rises only a little.
Wave 2
Wave 2 often retraces most of wave 1 and makes traders believe the old trend has returned. Fear comes back, but price holds above the start of wave 1. Volume usually drops compared with wave 1.
Wave 3
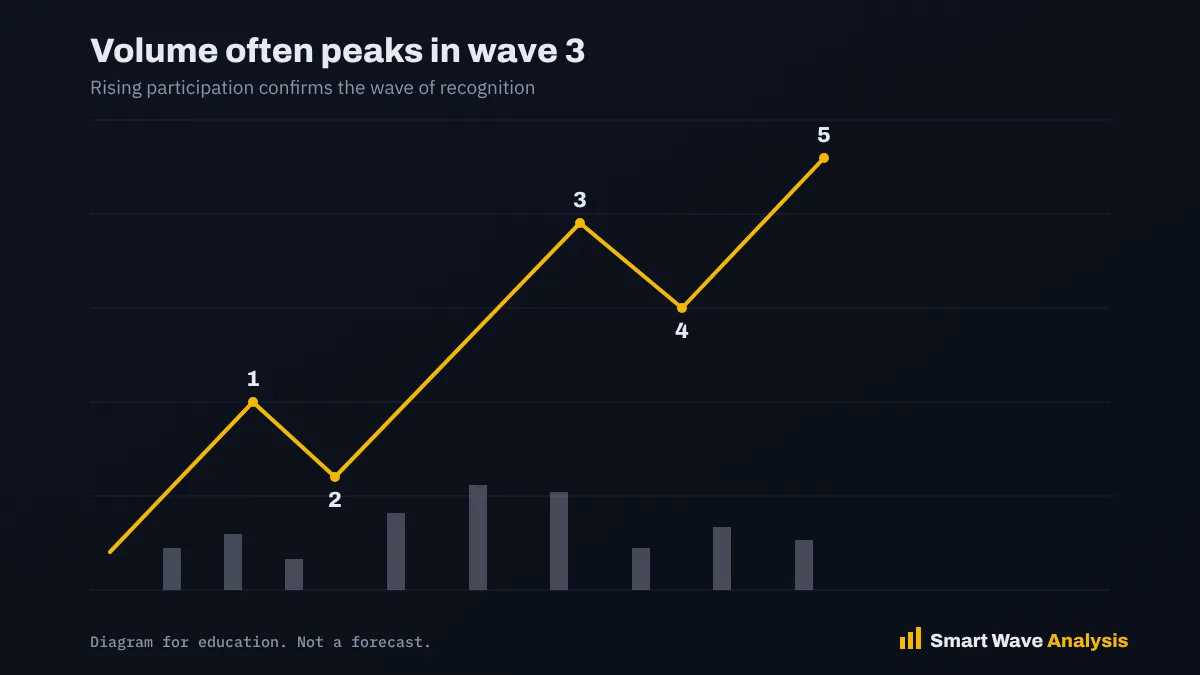
Wave 3 is the wave of recognition. The crowd sees that a new trend is underway. Price moves strongly with few pullbacks, volume and breadth expand, and good news starts to appear. Gaps in the trend direction are common. Wave 3 is often the longest wave.
Wave 4
Wave 4 is usually slow, frustrating and sideways. It often forms a flat or triangle. Many traders get bored or shaken out. Wave 4 often ends near the end of the smaller wave 4 inside wave 3.
Wave 5
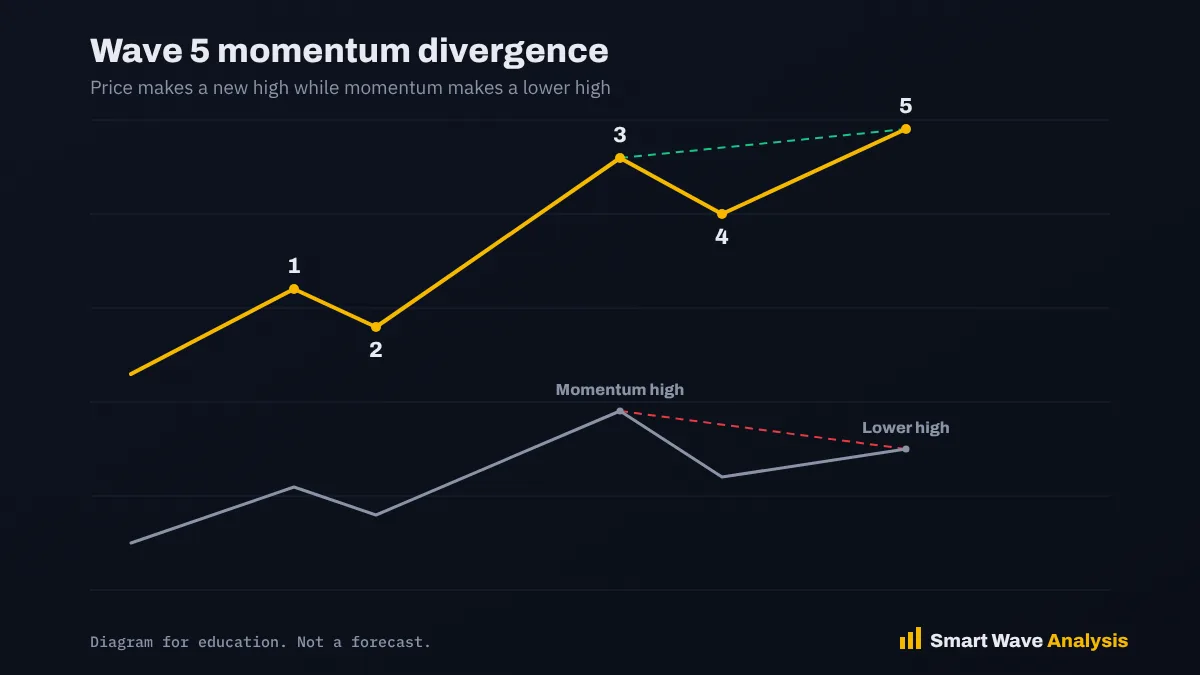
Wave 5 takes price to a new extreme, but momentum indicators such as RSI often show a divergence, making a lower high while price makes a higher high. Optimism is high and news is very good. In stocks, fewer shares join the rally. In crypto and commodities, wave 5 can be the most emotional and fastest wave.
Corrective waves
Wave A
Most traders see wave A as a normal pullback in an ongoing trend. Some technical damage appears, but sentiment stays positive.
Wave B
Wave B is the trap. It looks like the trend is back, but it is driven by hope rather than strength. Volume and breadth are often poor. Some wave B rallies even make a new high, which fools many traders.
Wave C
Wave C is often fast and wide, much like a wave 3 in the opposite direction. Hope disappears, and the correction completes. Wave C often reaches 100 percent or 161.8 percent of wave A.
How to use wave personality
- Check momentum. A strong, wide move with expanding volume is more likely a wave 3 or C.
- Check sentiment. Extreme optimism near a high suggests wave 5 or wave B.
- Check structure first, then use personality to choose between counts.
Frequently asked questions
Which Elliott wave is the strongest?
Wave 3 is usually the strongest and longest, with expanding volume and broad participation.
Why is wave B called a trap?
It looks like a return of the trend, but it is a corrective move that often fails, catching traders on the wrong side.
How can I spot wave 5?
Wave 5 often makes a new price extreme while momentum indicators make a lower high, a sign called divergence.
Sources and further reading
- Frost, A. J. and Prechter, R. R., Elliott Wave Principle: Key to Market Behavior (1978) (Wikipedia (author page))
- Elliott wave principle (Wikipedia)
- Relative Strength Index (RSI) (Investopedia)
Educational content only. Nothing on this page is financial advice or a recommendation to buy or sell. Trading involves risk and you can lose money. Elliott Wave counts are probabilities, not certainties. Read our full disclaimer and affiliate disclosure.