Elliott Wave theory says that prices move in repeating patterns driven by crowd psychology: five waves in the direction of the main trend, followed by three waves against it. Traders use it to judge where a market is in its cycle, where a move may end and where their view is proven wrong.
What is Elliott Wave theory?
Elliott Wave theory is a form of technical analysis that looks for repeating wave patterns in price charts. It was developed by Ralph Nelson Elliott, an American accountant, who studied decades of stock market data in the 1930s. He found that prices move in a natural rhythm of advances and declines, and he published his findings in The Wave Principle in 1938.
The theory became widely known after A. J. Frost and Robert Prechter published Elliott Wave Principle: Key to Market Behavior in 1978. Today it is taught in the Chartered Market Technician (CMT) program and used by traders in stocks, forex, commodities and crypto.
The 5-3 wave pattern
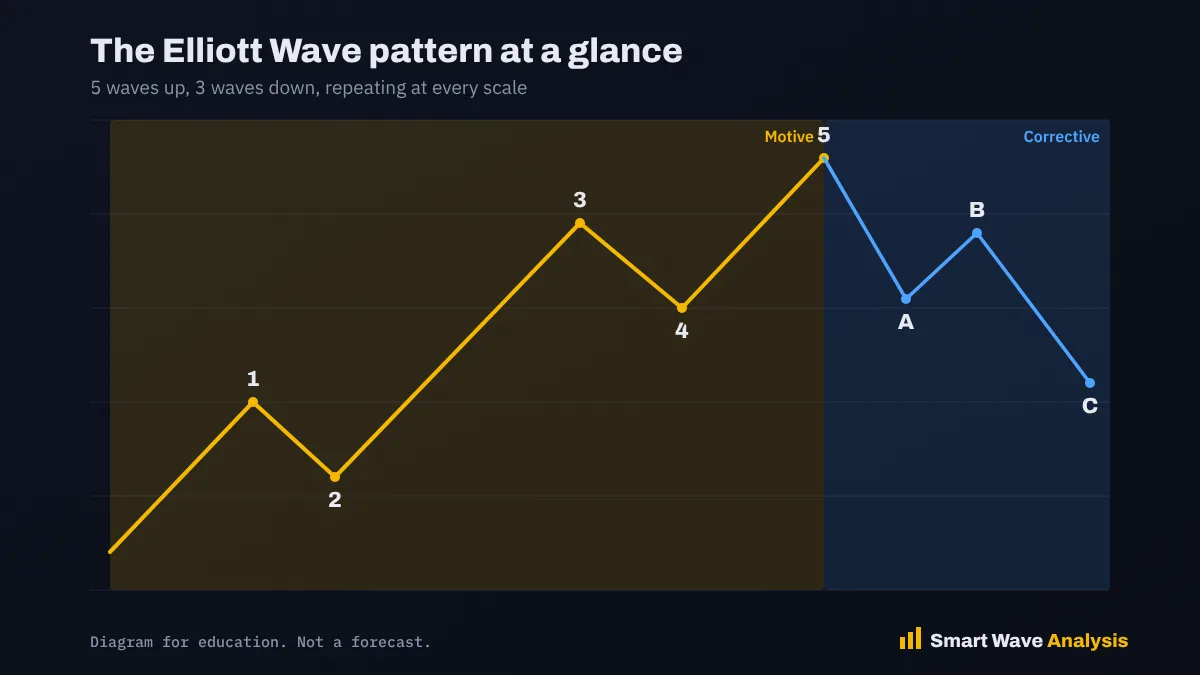
The core of the theory is simple. A market moving with its main trend does so in five waves, labelled 1 to 5. A correction against that trend unfolds in three waves, labelled A, B and C.
- Waves 1, 3 and 5 move with the trend. They are called motive waves.
- Waves 2 and 4 move against the trend. They are called corrective waves.
- Waves A, B and C correct the whole five-wave move.
Each wave is built from smaller waves, and each is part of a larger wave. This repeating structure is called fractal. A five-wave rally on a daily chart may be wave 1 of a larger rally on a weekly chart.
Why markets move in waves
Prices are set by people, and people tend to follow the crowd. Optimism grows slowly, spreads, then peaks. Pessimism does the same. Elliott believed these swings in mood follow a pattern that repeats because human nature does not change. This is why the same patterns appear in the 1929 Dow, the 2000 Nasdaq and Bitcoin’s cycles.
The three rules you must know
Elliott Wave has only three strict rules for a five-wave impulse:
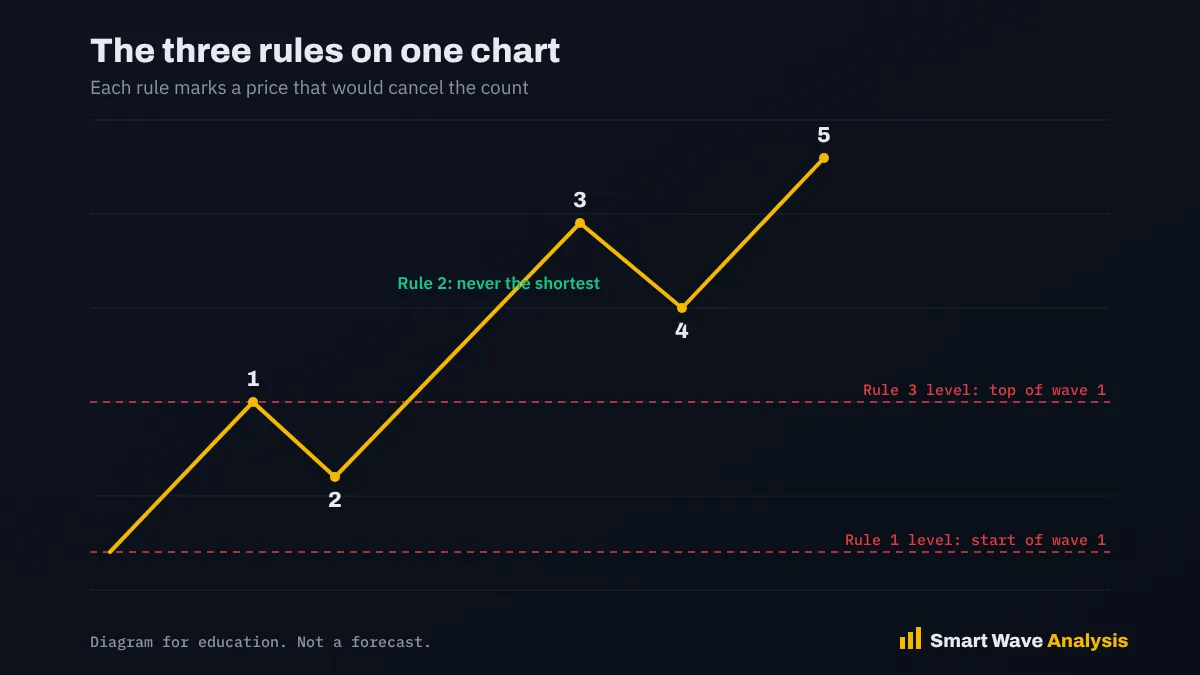
- Wave 2 never retraces more than 100 percent of wave 1.
- Wave 3 is never the shortest of waves 1, 3 and 5.
- Wave 4 never enters the price range of wave 1 (except in diagonals).
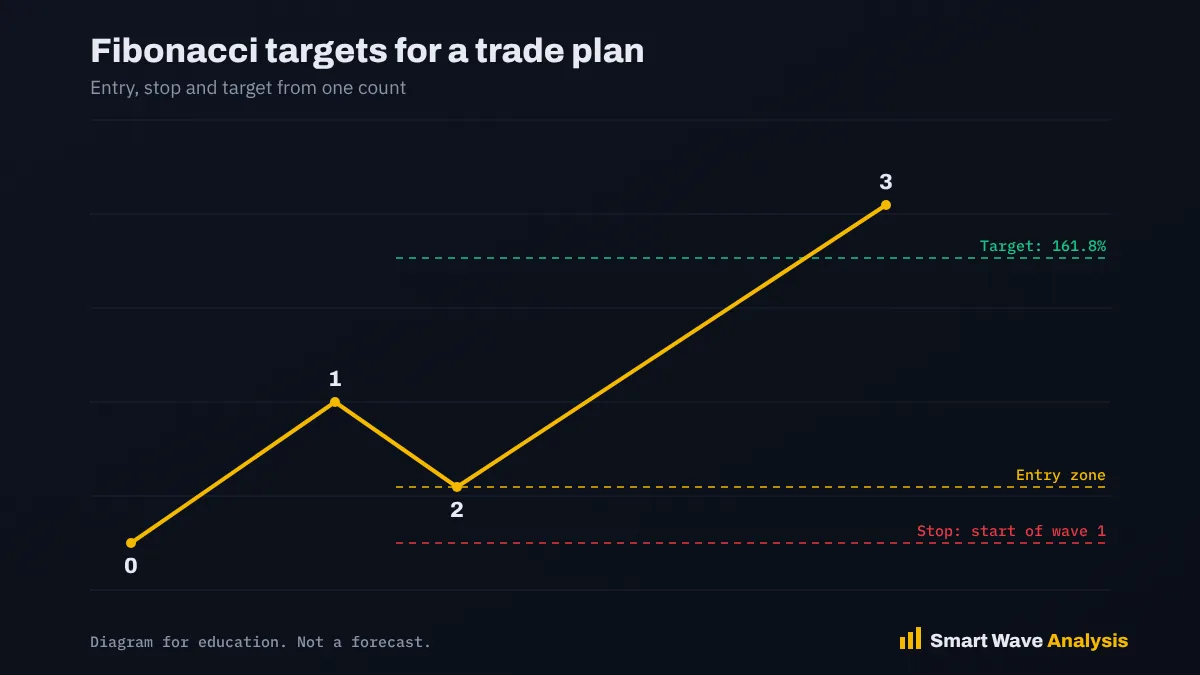
If a count breaks one of these rules, it is wrong. The level where a rule would break is your invalidation level and a natural stop loss. Read the full lesson on the three rules.
Fibonacci and Elliott Wave
Elliott noticed that wave counts match Fibonacci numbers: 5 waves up, 3 down, 8 in total, then 21, 34, 89 and 144 at higher degrees. Analysts later found that wave lengths often relate by Fibonacci ratios such as 0.618 and 1.618.
- Wave 2 often retraces 50 to 61.8 percent of wave 1.
- Wave 3 often reaches 1.618 times the length of wave 1.
- Wave 4 often retraces 23.6 to 38.2 percent of wave 3.
- Wave C often equals wave A.
Try these numbers on a real chart with the Elliott Wave target calculator.
The main corrective patterns
Corrections are harder to read than trends because they come in several forms:
- Zigzag: a sharp 5-3-5 pullback, common in wave 2.
- Flat: a sideways 3-3-5 pattern, common in wave 4.
- Triangle: five overlapping waves that come before the final move.
- Double three: two patterns joined together to extend a correction in time.
How to count waves, step by step
- Start big. Open a weekly chart and find the largest clear swings.
- Find the trend. Is the big move up or down? Motive waves go with it.
- Label the clearest impulse. Look for five waves where wave 3 is strong and wave 4 does not overlap wave 1.
- Check the rules. If any rule breaks, try a different count.
- Use guidelines to choose. Alternation, channels and Fibonacci ratios help pick the best count.
- Set an invalidation level. Write down the price that proves your count wrong.
- Keep an alternate. Always have a second count ready.
- Drop down a timeframe. Refine the current wave on daily and 4-hour charts.
Common mistakes beginners make
- Forcing a count to match what they want the market to do.
- Ignoring the rules when a favorite count breaks.
- Counting on very small timeframes without knowing the bigger picture.
- Trading without a stop at the invalidation level.
- Expecting exact turning points instead of zones.
Strengths and limits of Elliott Wave
Elliott Wave gives a complete map: it suggests direction, targets and a clear point where the view fails. Few methods offer all three. Its main limit is that it is subjective. Two analysts can count the same chart differently, especially during complex corrections. Academic research on its predictive power is limited, so it is best used as a framework for managing risk, not as a crystal ball.
Where to go next
Work through the free Learn section in order, use the glossary for new terms, and practice on any of our 90+ market pages.
Frequently asked questions
Is Elliott Wave theory reliable?
It is a framework for probabilities, not a guarantee. Its strength is that every count has a clear invalidation level, which helps you manage risk.
What is the best timeframe for Elliott Wave?
Start on weekly and daily charts to find the main structure, then use 4-hour and 1-hour charts for timing.
Can Elliott Wave be used for crypto?
Yes. Bitcoin and other large coins often show clear wave patterns because they are driven by crowd sentiment.
What is the difference between motive and corrective waves?
Motive waves move with the main trend in five waves. Corrective waves move against it, usually in three waves.
Sources and further reading
- Elliott wave principle (Wikipedia)
- Frost, A. J. and Prechter, R. R., Elliott Wave Principle: Key to Market Behavior (1978) (Wikipedia (author page))
- Elliott Wave Theory: What You Need to Know (Investopedia)
- Chartered Market Technician program (CMT Association)
- Fibonacci sequence (Encyclopaedia Britannica)
Educational content only. Nothing on this page is financial advice or a recommendation to buy or sell. Trading involves risk and you can lose money. Elliott Wave counts are probabilities, not certainties. Read our full disclaimer and affiliate disclosure.



