A flat is a sideways three-wave correction that subdivides 3-3-5. Wave B retraces nearly all of wave A, often 90 percent or more, and wave C ends near or beyond the end of wave A. Flats often appear in wave 4 positions.
Structure
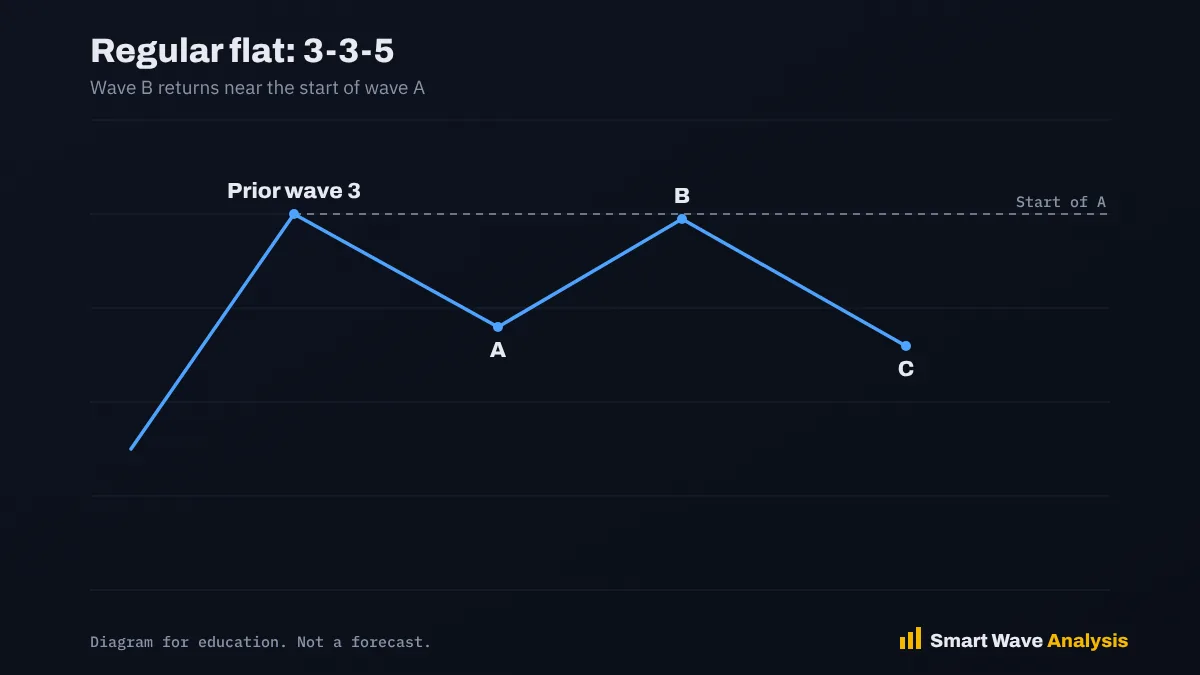
In a flat, wave A is a three-wave move, wave B is a three-wave move that returns close to the start of wave A, and wave C is a five-wave move. Because wave A is only three waves, the trend is not strongly challenged, which is why flats look sideways rather than sharp.
Types of flats
Regular flat
Wave B ends near the start of wave A, and wave C ends a little beyond the end of wave A.
Expanded flat
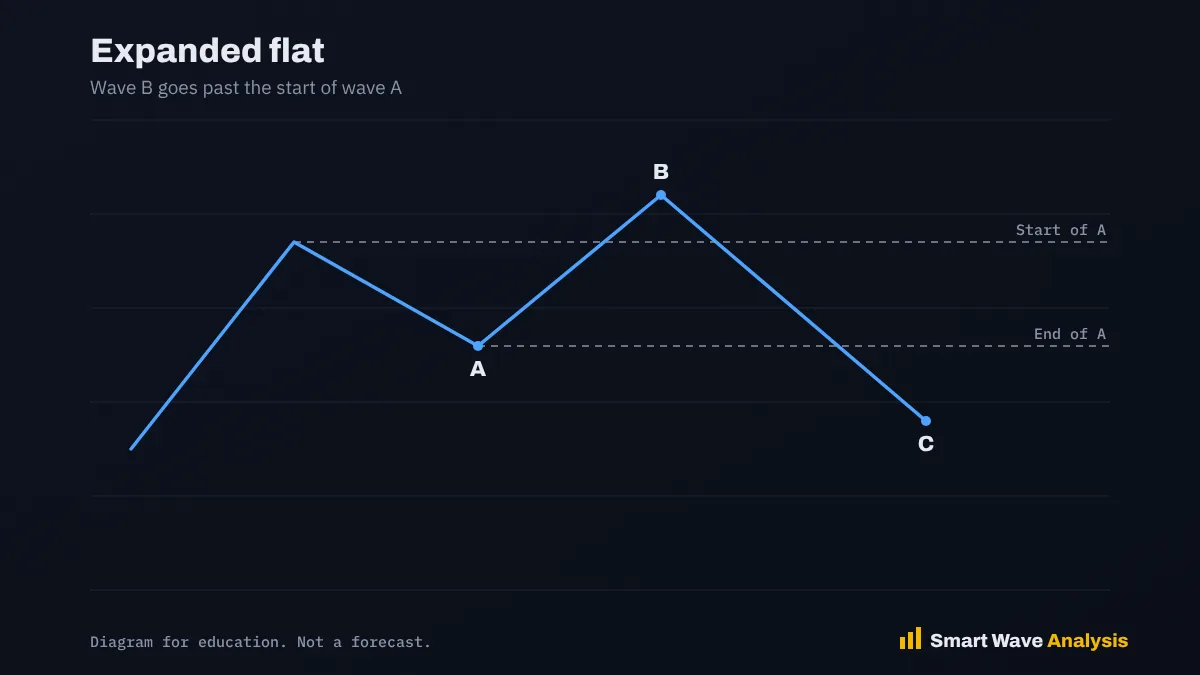
Wave B goes beyond the start of wave A, often reaching 123.6 to 138.2 percent of wave A, and wave C ends well beyond the end of wave A, often at 161.8 percent of wave A. The expanded flat is the most common type. Its wave B can trap traders into thinking the trend has resumed.
Running flat
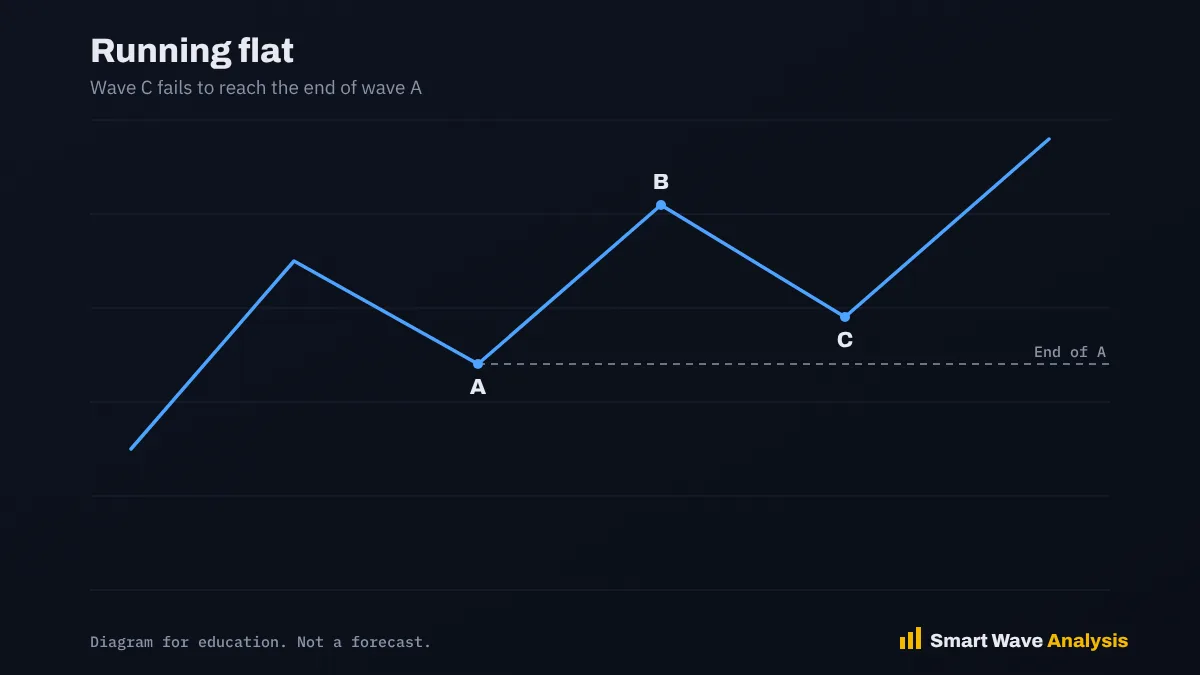
Wave B goes beyond the start of wave A, but wave C does not reach the end of wave A. Running flats show a very strong underlying trend and are relatively rare.
Where flats appear
Flats often appear in wave 4, and they alternate well with a sharp zigzag in wave 2. They also appear as wave B of larger corrections and inside complex patterns.
Trading tips
- If wave A of a correction is a three-wave move, think flat or triangle rather than zigzag.
- In an expanded flat, do not chase the wave B breakout. Watch for wave C to follow.
- Target 100 to 161.8 percent of wave A for wave C.
Frequently asked questions
How does a flat correction subdivide?
3-3-5: waves A and B have three waves each and wave C has five.
What is an expanded flat?
A flat where wave B goes past the start of wave A and wave C ends well beyond the end of wave A.
Where do flats usually appear?
Often in wave 4 and in wave B of larger corrections.
Sources and further reading
- Frost, A. J. and Prechter, R. R., Elliott Wave Principle: Key to Market Behavior (1978) (Wikipedia (author page))
- Elliott wave principle (Wikipedia)
Educational content only. Nothing on this page is financial advice or a recommendation to buy or sell. Trading involves risk and you can lose money. Elliott Wave counts are probabilities, not certainties. Read our full disclaimer and affiliate disclosure.