Elliott noticed that impulses often move within parallel trend channels. Drawing a channel from the ends of waves 2 and 4, with a parallel line through wave 3, helps project where wave 5 may end.
Why channels work
Trends often move at a steady pace, with each push and pullback staying within a band. Elliott used channels to confirm counts and to estimate targets.
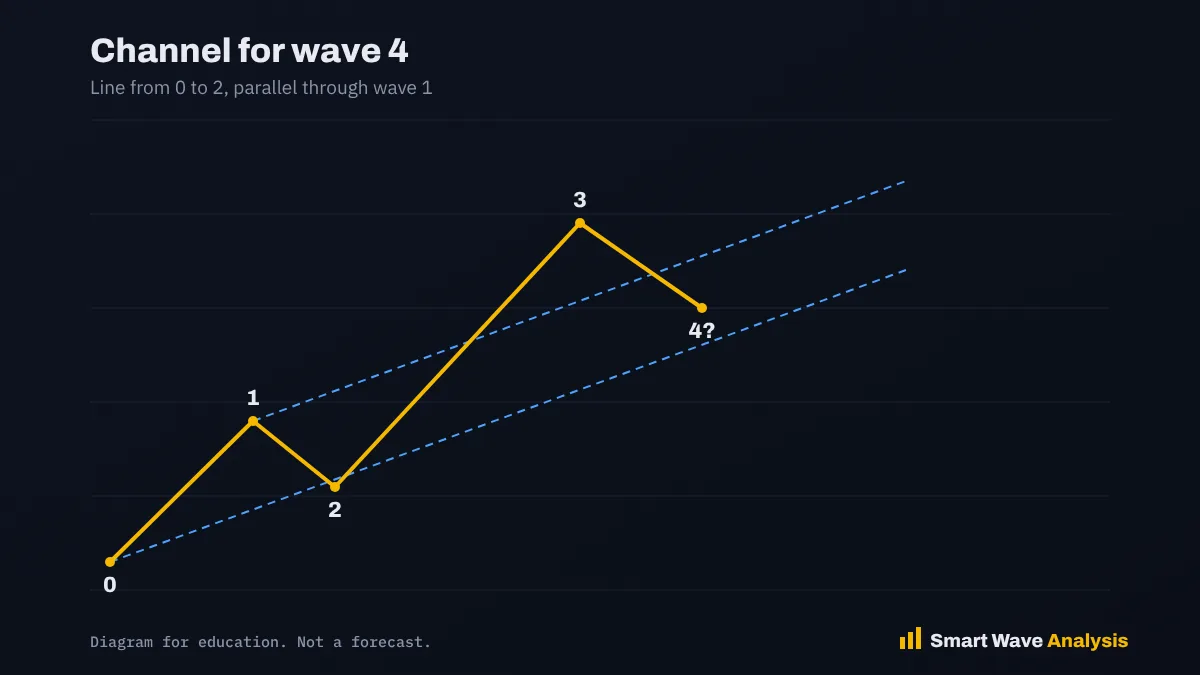
Step 1: Project wave 4
After wave 3 ends, draw a line from the start of wave 1 (the wave 0 point) to the end of wave 2. Then draw a parallel line through the end of wave 1. Wave 4 often finds support near this parallel line, depending on the wave 3 extension. Many traders instead draw the base line from 0 to 2 and the parallel through the end of wave 3, and look for wave 4 near the base line.
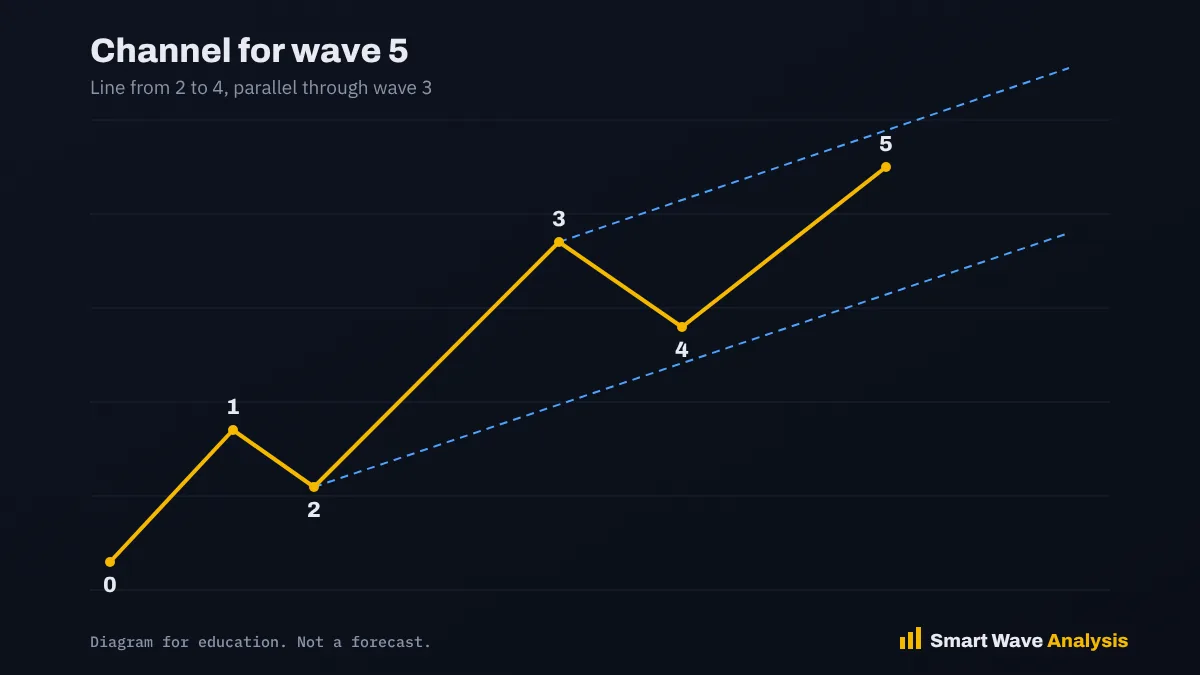
Step 2: Project wave 5
Once wave 4 ends, redraw the base line through the ends of waves 2 and 4. Draw a parallel line through the end of wave 3. Wave 5 often ends near this upper line.
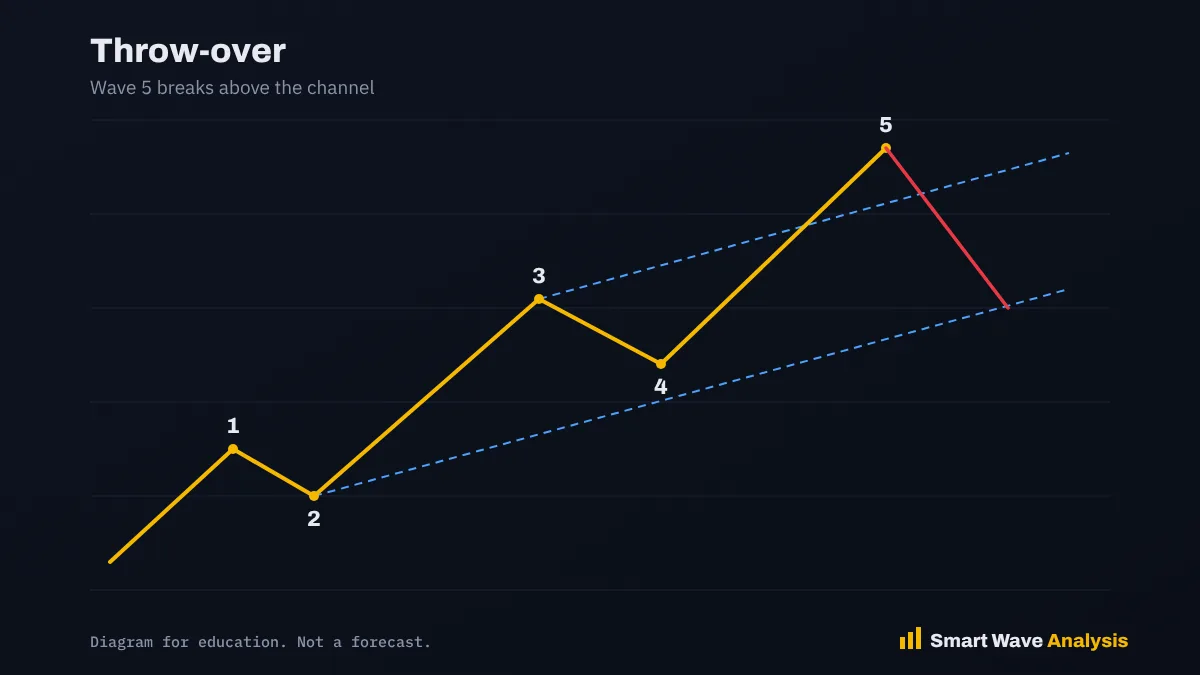
Throw-overs
In strong markets, wave 5 sometimes breaks above the upper channel line, called a throw-over. It often comes with a volume spike and can signal the end of the move, especially in ending diagonals.
Linear and log scale
On long term charts with large price changes, such as Bitcoin, use a logarithmic scale. A channel that does not fit on a linear chart often fits well on a log chart, because log scales show percentage moves evenly.
Tips
- Use channels with Fibonacci targets to find confluence zones.
- If price breaks below the 2-4 line after wave 5 begins, it is a sign the impulse may be complete or the count is wrong.
Frequently asked questions
How do you draw an Elliott Wave channel?
Draw a line through the ends of waves 2 and 4, then a parallel line through the end of wave 3. Wave 5 often ends near the upper line.
What is a throw-over?
A move by wave 5 beyond the channel line, often seen near the end of a trend.
Should I use log or linear scale?
Use log scale for long term charts with large percentage moves, such as crypto.
Sources and further reading
- Frost, A. J. and Prechter, R. R., Elliott Wave Principle: Key to Market Behavior (1978) (Wikipedia (author page))
- Elliott wave principle (Wikipedia)
- Trendline (Investopedia)
Educational content only. Nothing on this page is financial advice or a recommendation to buy or sell. Trading involves risk and you can lose money. Elliott Wave counts are probabilities, not certainties. Read our full disclaimer and affiliate disclosure.