Fibonacci ratios help estimate how far each wave may travel. Wave 2 often retraces 50 to 61.8 percent of wave 1, wave 3 often reaches 1.618 times wave 1, and wave 4 often retraces 23.6 to 38.2 percent of wave 3. These are guidelines, not rules.
Where Fibonacci comes from
The Fibonacci sequence is named after Leonardo of Pisa, known as Fibonacci, who described it in his book Liber Abaci in 1202. Each number is the sum of the two before it: 0, 1, 1, 2, 3, 5, 8, 13, 21, 34, 55, 89, 144 and so on. As the numbers grow, the ratio between one number and the next gets closer to 0.618, and the ratio of one number to the one before gets closer to 1.618. This value is known as the golden ratio.
Elliott noticed that wave counts follow Fibonacci numbers: an impulse has 5 waves, a correction has 3, and a full cycle has 8. Later analysts found that wave lengths often relate by Fibonacci ratios too.

Key ratios used by traders
- Retracements: 23.6%, 38.2%, 50%, 61.8%, 78.6%. (50% is not a Fibonacci ratio but is widely used.)
- Extensions: 100%, 127.2%, 161.8%, 200%, 261.8%.
Typical ratios for each wave
| Wave | Common relationship |
|---|---|
| Wave 2 | Retraces 50% to 61.8% of wave 1 (sometimes up to 78.6%) |
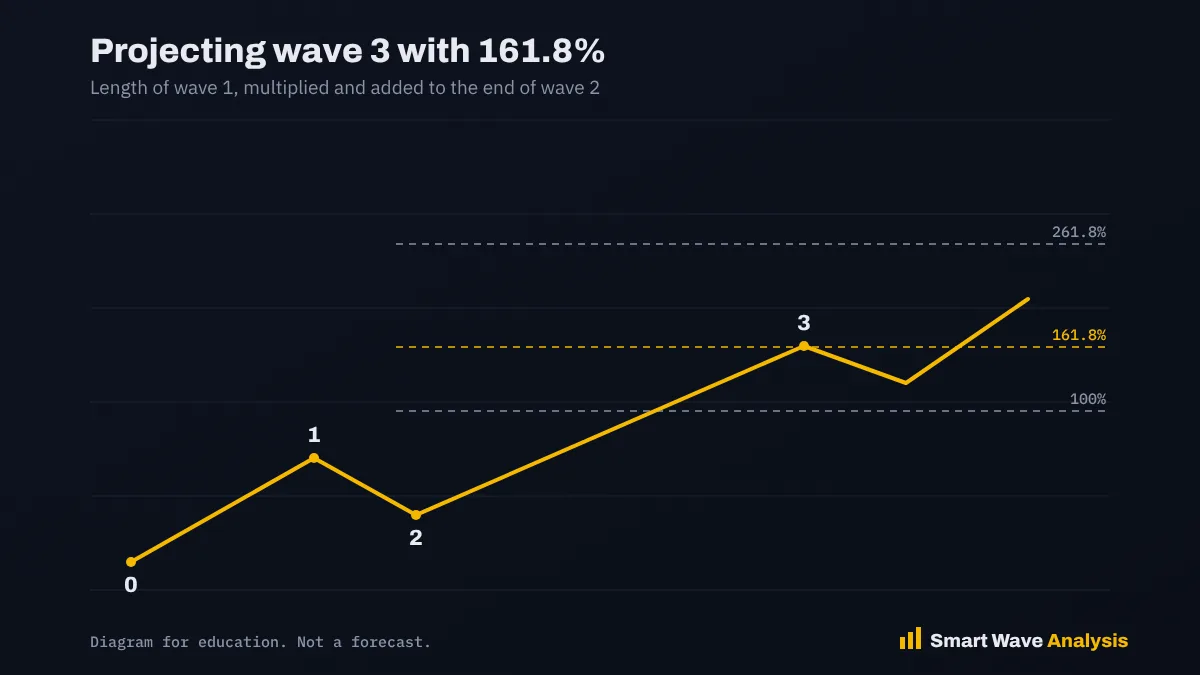
| Wave 3 | Equals 161.8% of wave 1, measured from the end of wave 2; 261.8% in strong trends |
| Wave 4 | Retraces 23.6% to 38.2% of wave 3 |
| Wave 5 | Equals wave 1, or 61.8% of the distance from the start of wave 1 to the end of wave 3 |
| Wave B | Retraces 50% to 78.6% of wave A in a zigzag; 90% or more in a flat |
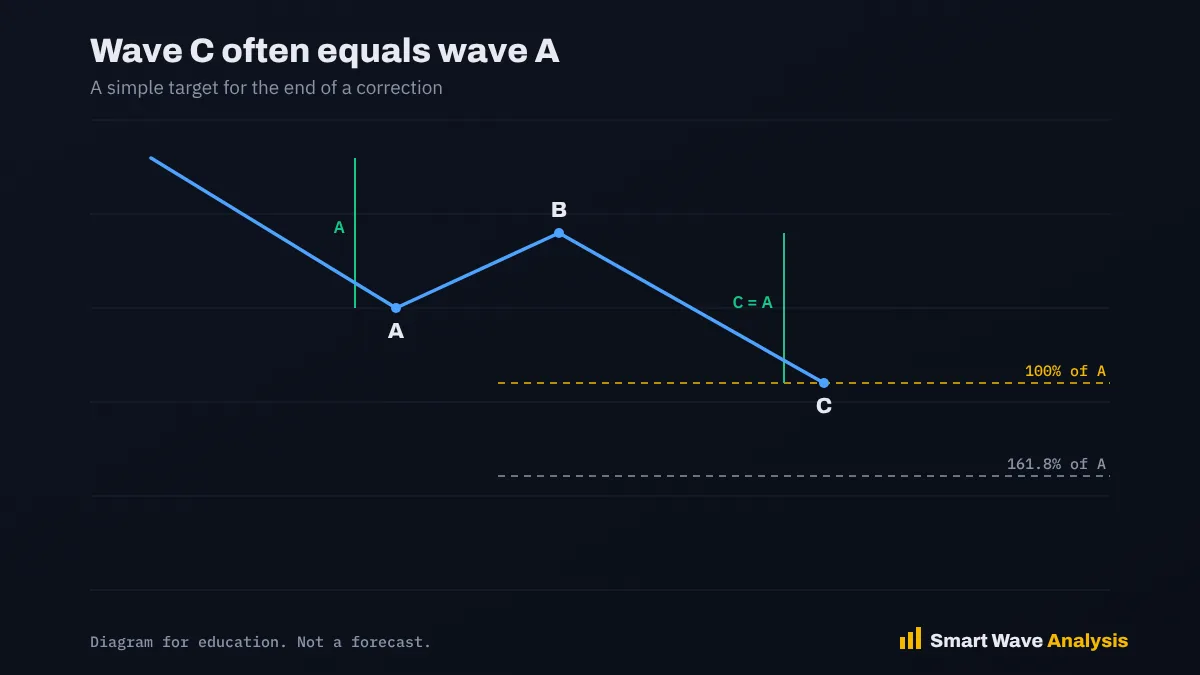
| Wave C | Equals wave A, or 161.8% of wave A |
How to project a target, step by step
- Find the start and end of wave 1. Say 100 to 120, a 20 point move.
- Find the end of wave 2. Say 108.
- Multiply wave 1’s length by 1.618: 20 × 1.618 = 32.36.
- Add it to the end of wave 2: 108 + 32.36 = 140.36. This is the first wave 3 target.
- Repeat with 2.618 for an extended wave 3 target: 108 + 52.36 = 160.36.
You can run these numbers instantly with our Elliott Wave target calculator and Fibonacci calculator.
Confluence: when levels stack up
The strongest target zones are where two or more measurements meet. For example, if the 61.8% retracement of wave 3 lines up with the end of the smaller wave 4 inside wave 3, that area has a higher chance of acting as support for wave 4.
A word of caution
Fibonacci ratios are guidelines. Markets often overshoot or stop short. Always use them with the three rules and an invalidation level, never alone.
Frequently asked questions
What is the most common wave 2 retracement?
Wave 2 most often retraces 50 to 61.8 percent of wave 1.
How do you calculate a wave 3 target?
Multiply the length of wave 1 by 1.618 and add it to the end of wave 2. Use 2.618 for an extended wave 3.
Is 50 percent a Fibonacci ratio?
No, but it is widely used because markets often retrace about half of a prior move.
Sources and further reading
- Fibonacci sequence (Encyclopaedia Britannica)
- Golden ratio (Wikipedia)
- Fibonacci Retracement Levels (Investopedia)
- Frost, A. J. and Prechter, R. R., Elliott Wave Principle: Key to Market Behavior (1978) (Wikipedia (author page))
Educational content only. Nothing on this page is financial advice or a recommendation to buy or sell. Trading involves risk and you can lose money. Elliott Wave counts are probabilities, not certainties. Read our full disclaimer and affiliate disclosure.