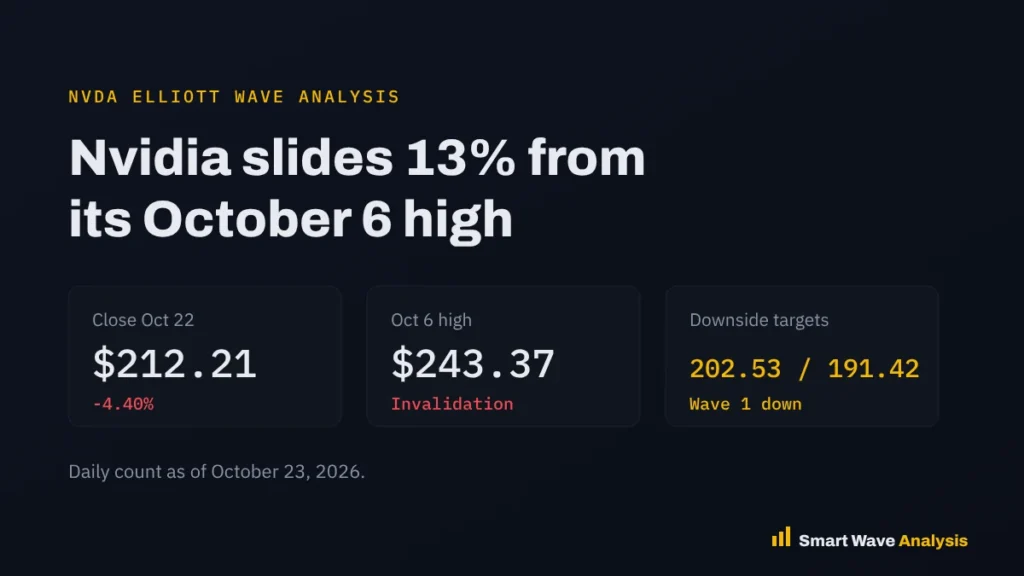
Nvidia (NVDA) fell 4.40% to $212.21 on October 22, 2026, about 12.8% below its October 6 high of 243.37. On our daily chart, the stock is in wave 1 down of a new decline from that high. The targets are 202.53 and 191.42, and the bearish view stays valid while price holds below 243.37. Count date: October 23, 2026.
Nvidia is still growing at an amazing pace, but the stock has turned lower since early October. This post explains why chip stocks sold off, what the latest numbers say about the business, and where the Nvidia Elliott Wave analysis sees the next support.
Why Nvidia fell on October 22, 2026
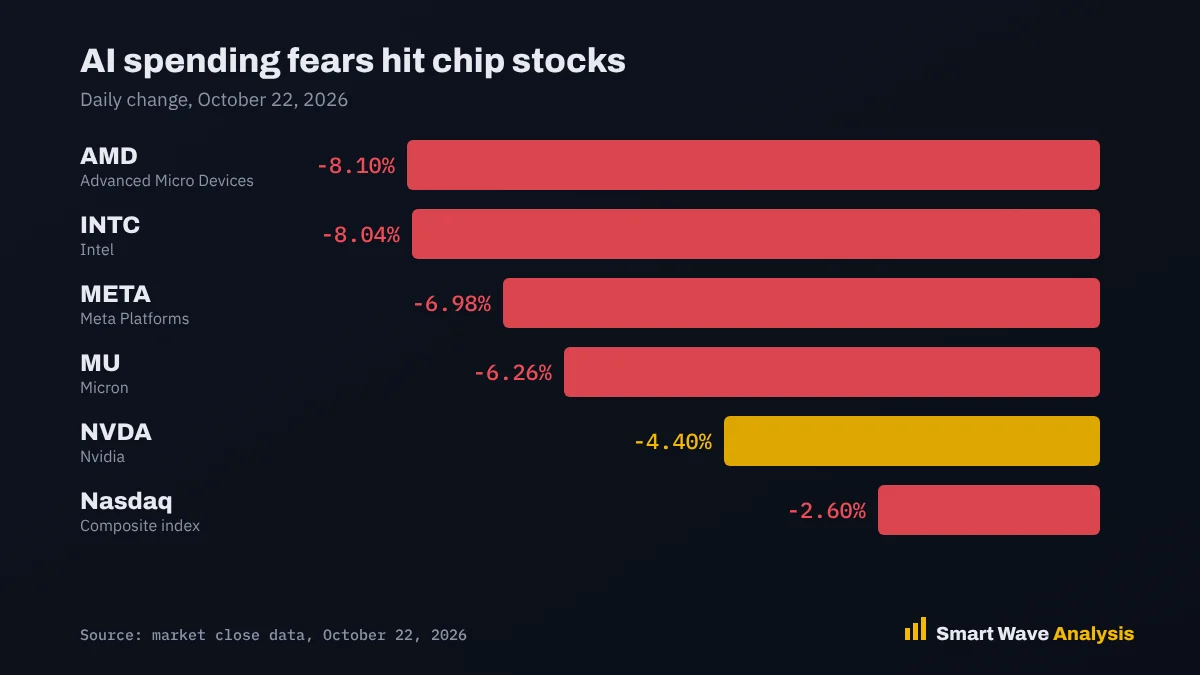
There was no Nvidia specific news. The stock dropped $9.76 on volume of 125.4 million shares, about 19% above its 30 day average, according to Gotrade market data. The whole chip group fell as worries about AI spending came back:
| Stock | Company | Daily change |
|---|---|---|
| AMD | Advanced Micro Devices | -8.10% |
| INTC | Intel | -8.04% |
| META | Meta Platforms | -6.98% |
| MU | Micron | -6.26% |
| NVDA | Nvidia | -4.40% |
| Nasdaq | Composite index | -2.60% |
Three earnings reports set the tone, as Invezz reported:
- Meta raised the low end of its 2026 spending plan to $135 billion from $130 billion. Investors worried about the return on all that money.
- Tesla cut its 2026 spending forecast to about $20 billion from more than $25 billion, which raised the opposite fear: slower AI demand.
- Lam Research posted record revenue of $8.22 billion, but its outlook was only in line with estimates and the company flagged supply chain limits into 2027.
Tim Waterer of KCM Trade summed it up when he told Bloomberg that investors were “proving difficult to satisfy.” Higher spending raises doubts about returns, and lower spending raises doubts about growth. In that mood, chip stocks get sold either way.
The business is still strong
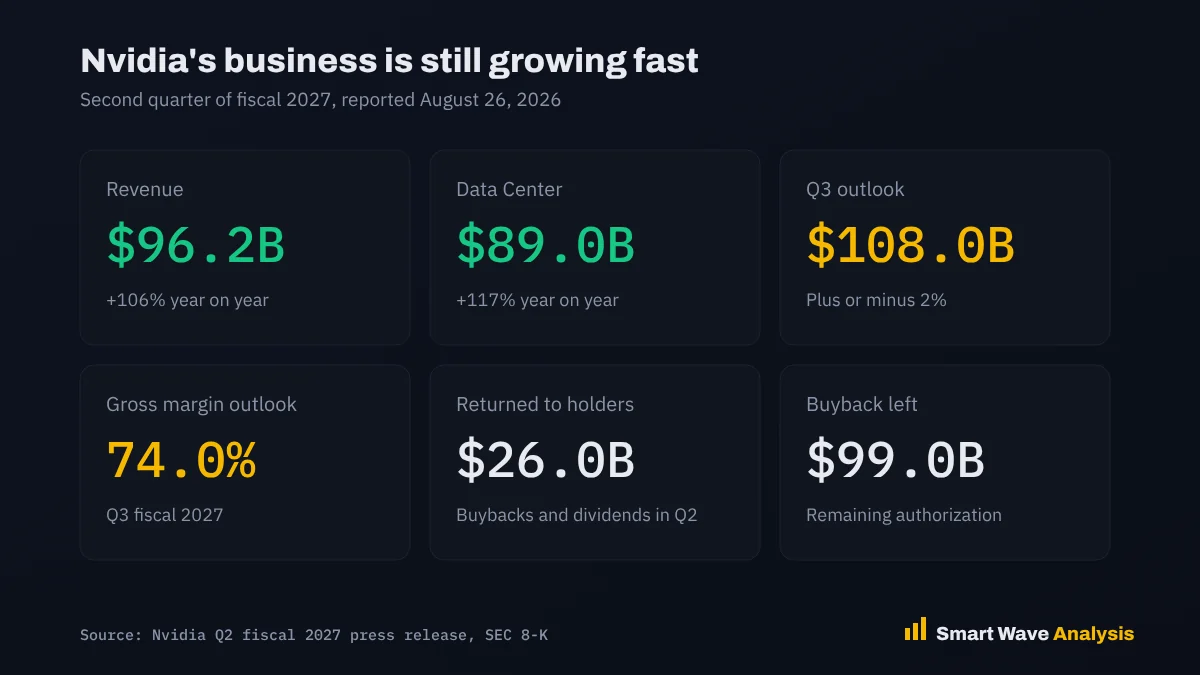
The selloff is about the stock price, not the company’s results. Nvidia’s last report showed revenue up 106% in a single year, according to its filing with the SEC.
| Item | Q2 fiscal 2027 | Note |
|---|---|---|
| Revenue | $96.2B | Up 106% from $46.7B a year earlier |
| Data Center revenue | $89.0B | Up 117% year on year |
| Q3 revenue outlook | $108.0B | Plus or minus 2%, with no China data center sales assumed |
| Gross margin outlook | 74.0% | Plus or minus 0.5 points |
| Returned to shareholders | $26.0B | Buybacks and dividends in the quarter |
Strong results do not stop a stock from correcting. After a big run, prices often pull back even when the news is good, and that is what the wave count shows now. The next earnings report is expected in the second half of November and is the biggest event risk for the count.
Nvidia Elliott Wave count
Nvidia rallied from its 52-week low at 164.27 to its 52-week high of 243.37 on October 6, 2026, a gain of about 48%. Our daily count reads the turn from that high as the start of a larger correction:
- October 6 high at 243.37: the end of the advance and the start of the decline.
- Lower high at 234.76: the bounce after the first drop failed below the high, a typical sign of a new downtrend.
- Wave 1 down: the decline to 211.26 on October 22 is still the first leg. It may need one more push lower before it ends.
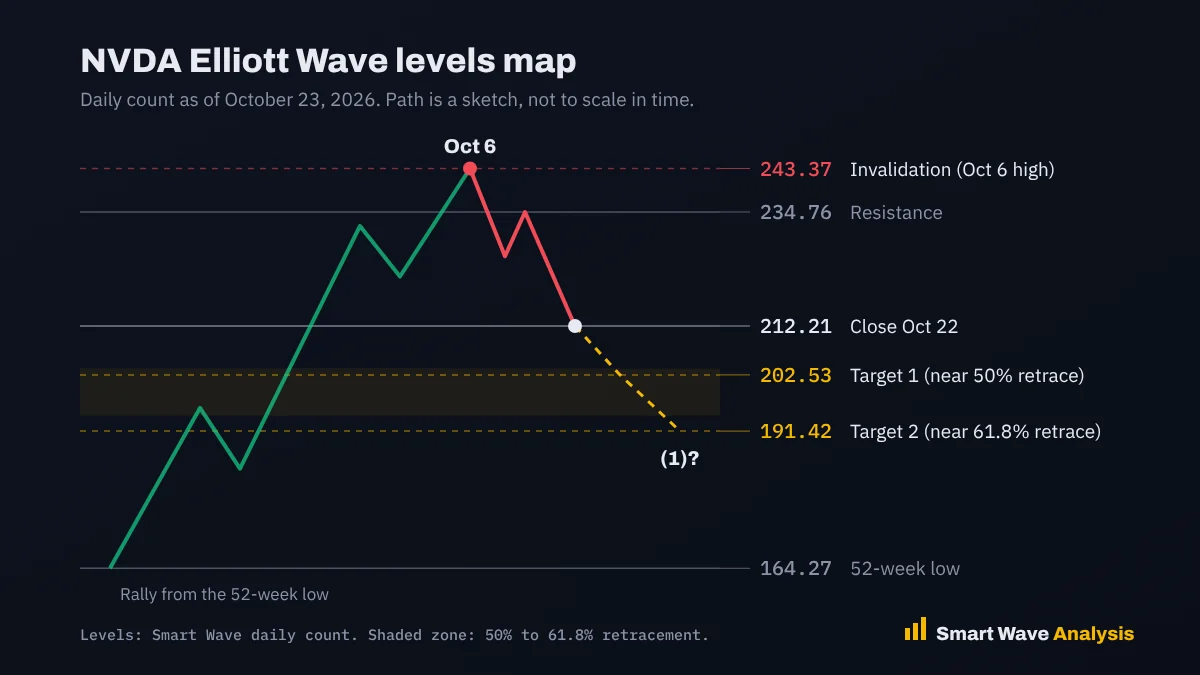
The targets line up with Fibonacci support. The 50% retracement of the rally from 164.27 to 243.37 sits at 203.82, and the 61.8% retracement sits at 194.49. Our wave targets at 202.53 and 191.42 fall right around that zone, which makes it the area where buyers are most likely to return. You can check the levels with our Fibonacci calculator and read how retracements work in our Elliott Wave Fibonacci lesson.
| Level | Price | Why it matters |
|---|---|---|
| Invalidation | 243.37 | October 6 high. A close above it cancels the bearish count |
| Resistance | 234.76 | Lower high after the first drop |
| Last close | 212.21 | October 22, 2026 |
| Support | 208.93 | Nearest swing support below price |
| Target 1 | 202.53 | Near the 50% retracement at 203.82 |
| Target 2 | 191.42 | Near the 61.8% retracement at 194.49 |
What this means for the Nasdaq 100
Nvidia is one of the two largest companies in the Nasdaq 100, with a market value of about $5.11 trillion. When it falls, the index usually follows. For the bigger picture, see our Nasdaq 100 Elliott Wave analysis and the QQQ page.
Trade plan
- Bearish viewSell bounces toward 220 to 225 while price stays below 234.76, with a stop above 234.76. The wider stop for a swing trade sits above 243.37.
- Targets202.53, then 191.42. Take some profit near 202.53, since the Fibonacci zone can bring buyers back fast.
- BuyersWait for the 191 to 204 zone and a clear five-wave rise from there before buying for the long term.
- RiskSize each trade so a stop costs only 1% to 2% of your account. Our position size calculator does the math.
Want the next Nvidia count before the move?
Get professional Elliott Wave forecasts with updated charts, clear targets and invalidation levels for stocks, indices, forex, commodities and crypto.
- Daily chart updates
- Entry and stop levels
- Several timeframes
Frequently asked questions
Why did Nvidia stock fall on October 22, 2026?
There was no Nvidia specific news. The stock fell with other chip makers after earnings from Meta, Tesla and Lam Research raised new doubts about AI spending, and the Nasdaq Composite dropped 2.6%.
What is the Nvidia Elliott Wave target?
Our daily count puts Nvidia in wave 1 down from the October 6 high at 243.37, with targets at 202.53 and 191.42. Both sit near the 50% and 61.8% retracement of the rally from the 52-week low.
What would cancel the bearish Nvidia count?
A daily close above 243.37, the October 6 high, would cancel it. A close above 234.76 would be the first warning.
Is Nvidia’s business slowing down?
Not based on the latest numbers. Revenue grew 106% to $96.2 billion in the second quarter of fiscal 2027, and the company guided to about $108 billion for the third quarter.
Sources
- Nvidia via SEC EDGAR: Q2 fiscal 2027 financial results (August 26, 2026)
- Gotrade: Nvidia stock news and market data (October 23, 2026)
- Invezz: Why Wall Street is punishing AI spending either way (October 22, 2026)
This analysis is for education and is not financial advice. Elliott Wave counts are probabilities, not certainties. Read our risk disclaimer.
Free Elliott Wave e-books
 FREE
Elliott Wave Forecasting Guide
A clear introduction to forecasting markets with the Elliott Wave Principle.
Get the free e-book FREE
Elliott Wave Trading Strategies
Practical setups for entries, stops and exits using wave structure.
Get the free e-book FREE
Beginner's Guide to Forex Trading
Forex basics for new traders: pairs, pips, lots, sessions and risk.
Get the free e-book FREE
Guide to Trading Stocks and ETFs
How stock and ETF markets work and how to read them with wave analysis.
Get the free e-bookFree download after a short sign-up with the publisher.
Educational content only. Nothing on this page is financial advice or a recommendation to buy or sell. Trading involves risk and you can lose money. Elliott Wave counts are probabilities, not certainties. Read our full disclaimer and affiliate disclosure.