By the Smart Wave Analysis team. Published November 2, 2026. Prices as of 13:40 UTC.
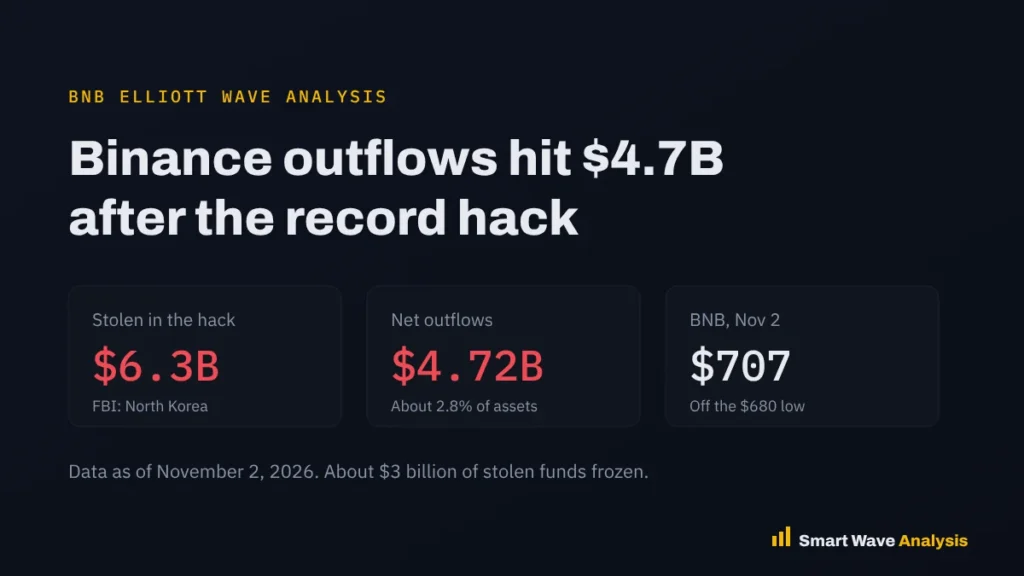
Binance customers pulled a net $4.72 billion after the exchange reopened withdrawals following a $6.3 billion hack that the FBI linked to North Korea. BNB fell from about $760 to near $680 and now trades around $707. Our count reads the fall from the September high as five completed waves, with a three-wave bounce toward 743.7 to 758.8 now possible. A move below 680 would cancel this view. Count date: November 2, 2026.
Key takeaways
- The hack: about $6.3 billion in crypto was taken from Binance, which the FBI tied to the North Korean group TraderTraitor. About $3 billion has been frozen.
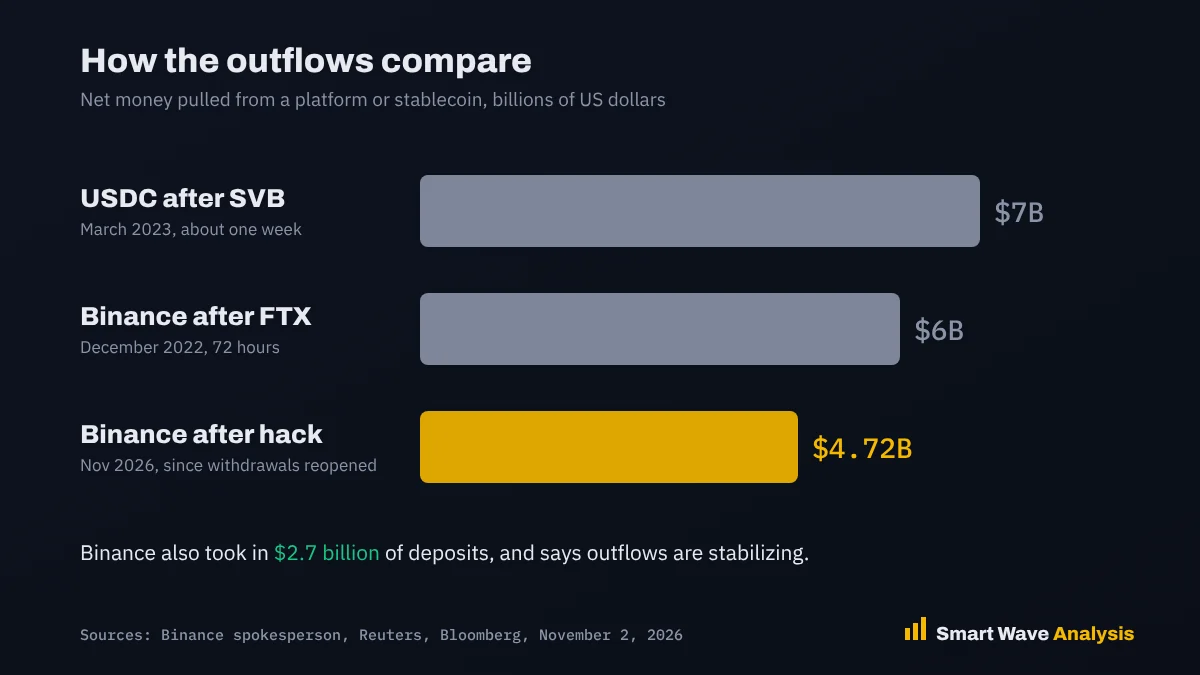
- The outflows: users pulled a net $4.72 billion, about 2.8% of platform assets, smaller than the roughly $6 billion that left Binance after the FTX collapse in 2022.
- BNB: the token fell about 10% to near $680 and has recovered to around $707.
- Wave view: a bounce toward 743.7 to 758.8 is possible while 680 holds, but the bigger trend since September is still down.
The Binance hack is the largest crypto theft on record, and it hit the world’s biggest exchange by volume. This post explains what happened, how customers reacted, and what the chart says about BNB. You can follow the daily count on our BNB analysis page.
What happened in the Binance hack
Binance paused withdrawals on October 29, 2026, after attackers drained hot wallets of about $6.3 billion in crypto. The FBI said on Saturday that a North Korean state group known as TraderTraitor was responsible. Official FBI statements are posted on the FBI press release page. Binance said its first review pointed to a compromised laptop of a DevOps engineer, not a leak of wallet private keys.
About half of the stolen funds were in stablecoins, and issuers moved quickly. Circle said it froze more than $1.1 billion in USDC, and Binance said about $3 billion in total has been frozen on-chain. North Korea-linked hackers have now stolen about $7.4 billion in 2026, according to TRM Labs. The US government tracks these groups on its CISA North Korea threat page.
How much money left Binance
When withdrawals reopened about 48 hours later, customers pulled a net $4.72 billion, about 2.8% of the assets on the platform. Binance also took in $2.7 billion of deposits and said withdrawal volumes had declined and were stabilizing.
Binance said it is covering losses with company money and has raised $6 billion from its treasury, an insurance fund and security reserves. Co-CEO Yi He said the top priority is making the platform secure before operations fully resume. The exchange serves more than 335 million users and handles about $95 billion in average daily trading volume.
How BNB and the crypto market reacted
BNB, the token tied to Binance, fell from about $760 before the hack to an intraday low near $680, a drop of about 10%. It quickly recovered above $700 and traded near $707 on November 2. Bitcoin hit a six-week low on Friday before recovering to around $78,000 on Monday, and more than $1.3 billion in leveraged crypto positions were wiped out. See our Bitcoin wave count for the bigger picture.
BNB Elliott Wave count
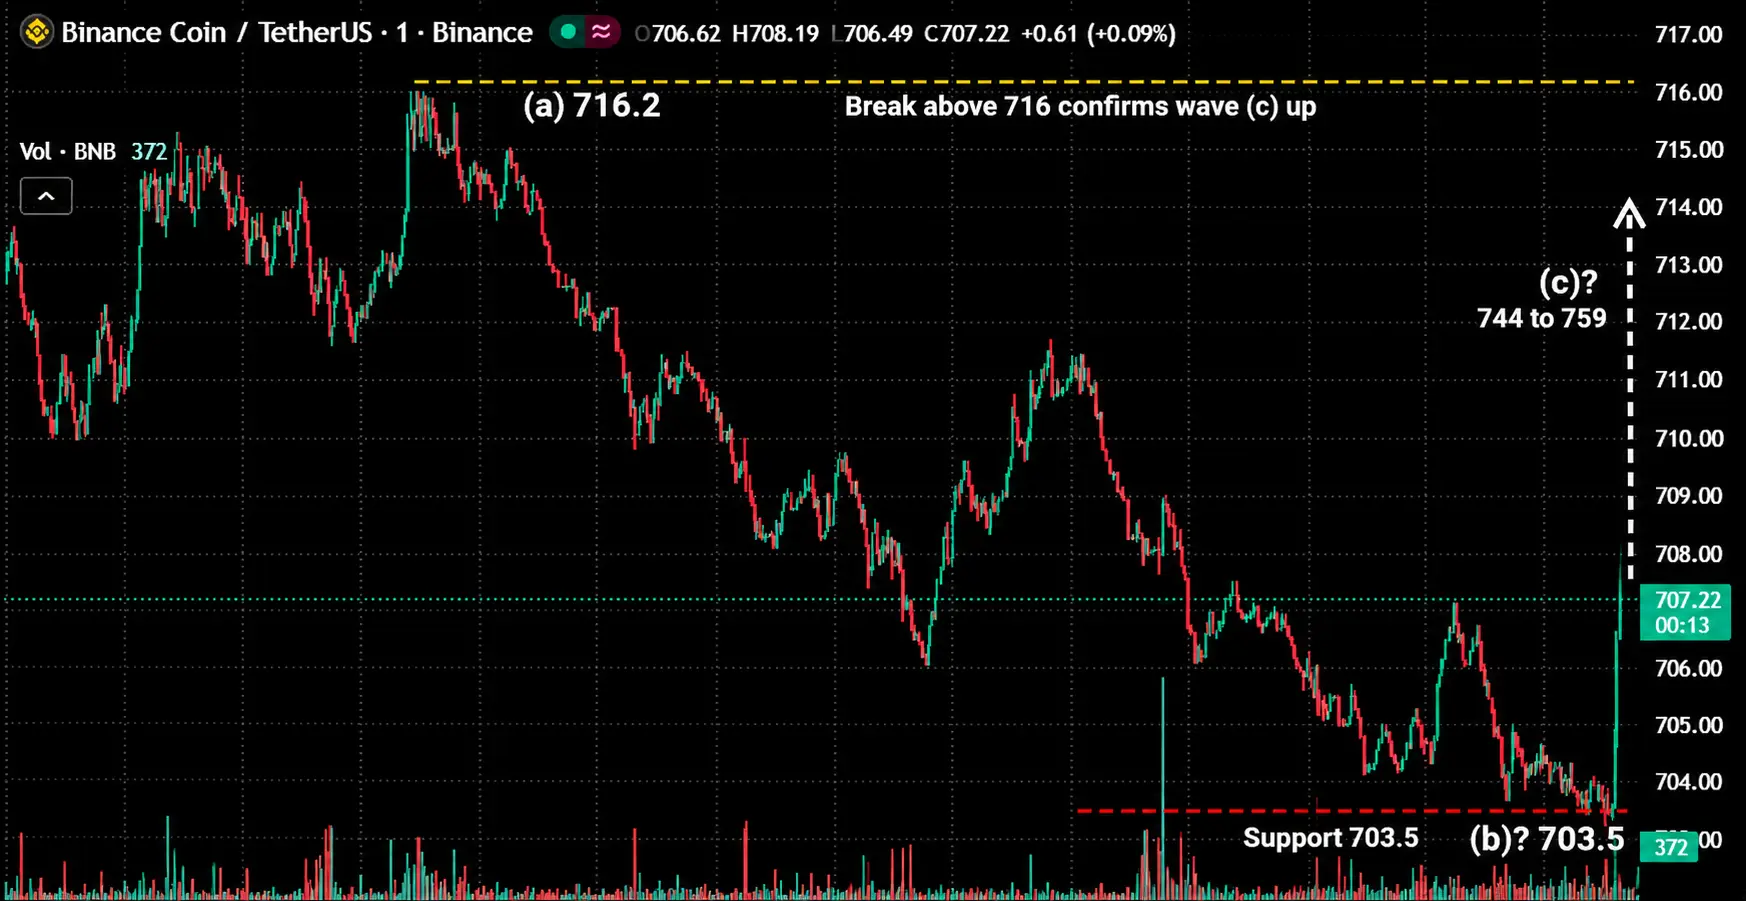
BNB peaked at 807.49 on September 21, 2026. Our count reads the decline since then as five waves down, with the hack panic forming the last leg:
- Waves 1 to 4: the fall from 807.49 into October, with wave 4 ending near 762.20 just before the hack.
- Wave 5: the hack selloff to about 680. Panic drops like this often end a five-wave move.
- Bounce, wave (a) and (b): the rise to 716.2 and the pullback to 703.5 on November 2. Wave (c) up may follow.
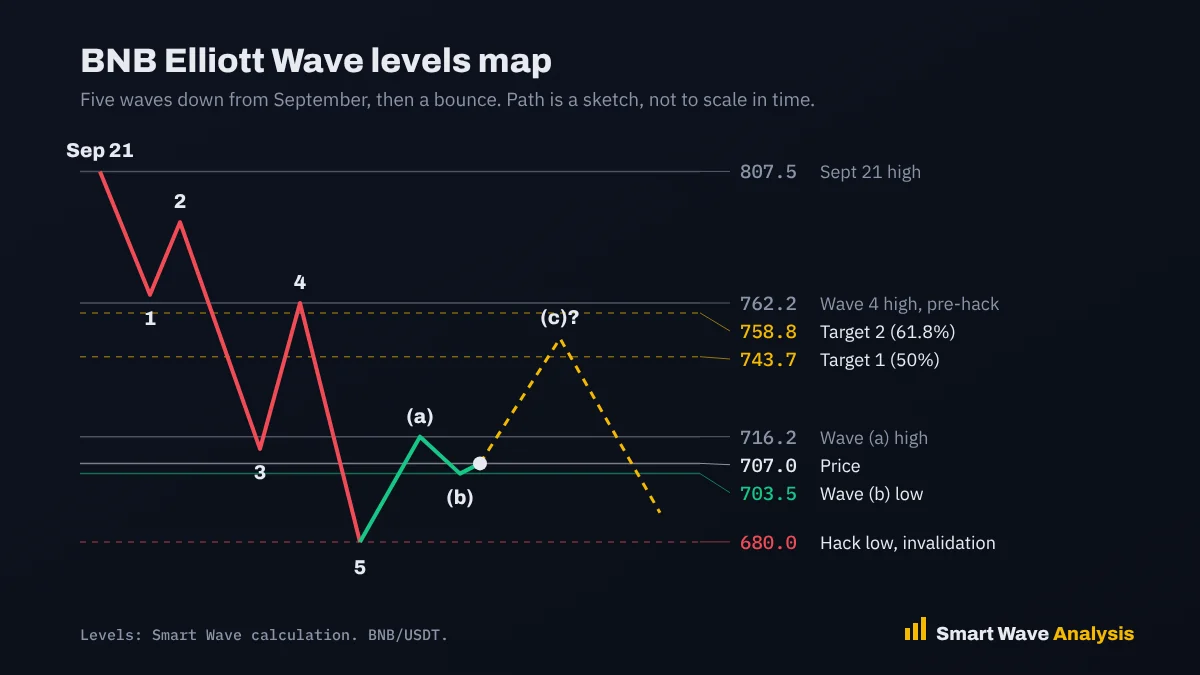
The bounce targets come from Fibonacci retracements of the whole decline from 807.49 to 680. The 50% level sits at 743.7 and the 61.8% level at 758.8, just below the wave 4 high at 762.20. That area, around $750, was support before the hack and is now the most likely place for sellers to return. Read how this kind of bounce forms in our zigzag correction lesson.
| Level | BNB | Why it matters |
|---|---|---|
| September high | 807.49 | Start of the five-wave decline |
| Wave 4 high | 762.20 | Last high before the hack |
| Target 2 | 758.8 | 61.8% retracement of the decline |
| Target 1 | 743.7 | 50% retracement of the decline |
| Wave (a) high | 716.2 | A break above confirms wave (c) |
| Wave (b) low | 703.5 | Short-term support |
| Invalidation | 680 | Hack low. A break below means the decline is not over |
How we built this count
We start from the daily chart to mark the decline from the September high, then use the 1-minute chart to time the current bounce. Prices come from the Binance BNB/USDT feed on TradingView. Targets use standard Fibonacci retracements of the full decline, and we compare them with our automatic daily wave scan. You can check the math with our Fibonacci calculator.
Trade plan
- Short-term buyersBuy dips toward 704 to 707 while 703.5 holds, with a stop below 699. Targets 716, then 743.7.
- SellersWait for the 743.7 to 758.8 zone. That is where the bigger downtrend may return.
- Headline riskNews about the hack, frozen funds or exchange solvency can move BNB fast. Use smaller positions than usual.
- RiskSize each trade so a stop costs only 1% to 2% of your account. Our position size calculator does the math.
Want the next crypto count before the move?
Get professional Elliott Wave analysis with updated charts, clear targets and invalidation levels for crypto, stocks, indices, forex and commodities.
- Daily chart updates
- Entry and stop levels
- Several timeframes
Frequently asked questions
How much was stolen in the Binance hack?
Binance estimated about $6.3 billion in affected crypto assets. The FBI said a North Korean state group known as TraderTraitor was behind it. About $3 billion has been frozen with help from stablecoin issuers and other partners.
How much money left Binance after the hack?
Binance said customers pulled a net $4.72 billion after withdrawals reopened, about 2.8% of platform assets. It also took in $2.7 billion of deposits and said outflows were stabilizing.
Are Binance user funds safe?
Binance said user funds are completely safe and that it is covering losses with company money, raising $6 billion from its treasury, insurance fund and security reserves.
What is the BNB Elliott Wave outlook?
Our count reads the drop from the September high at 807.49 to the hack low near 680 as five completed waves. A three-wave bounce may now reach 743.7 to 758.8. A move below 680 would cancel this view.
Sources
This analysis is for education and is not financial advice. Crypto assets are highly volatile. Elliott Wave counts are probabilities, not certainties. Read our risk disclaimer.
Free Elliott Wave e-books
 FREE
Elliott Wave Forecasting Guide
A clear introduction to forecasting markets with the Elliott Wave Principle.
Get the free e-book FREE
Elliott Wave Trading Strategies
Practical setups for entries, stops and exits using wave structure.
Get the free e-book FREE
Beginner's Guide to Forex Trading
Forex basics for new traders: pairs, pips, lots, sessions and risk.
Get the free e-book FREE
Guide to Trading Stocks and ETFs
How stock and ETF markets work and how to read them with wave analysis.
Get the free e-bookFree download after a short sign-up with the publisher.
Educational content only. Nothing on this page is financial advice or a recommendation to buy or sell. Trading involves risk and you can lose money. Elliott Wave counts are probabilities, not certainties. Read our full disclaimer and affiliate disclosure.