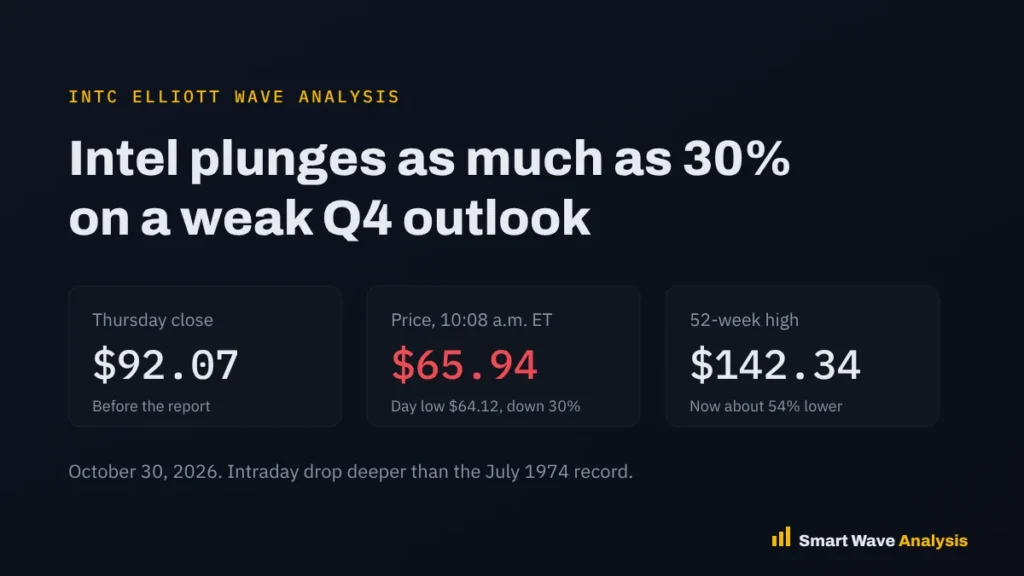
By the Smart Wave Analysis team. Published October 30, 2026. Prices as of 10:08 a.m. ET on October 30.
Intel stock (INTC) fell as much as 30% on October 30, 2026, to a low of $64.12, and traded near $65.94 at 10:08 a.m. ET. That intraday drop is deeper than its worst close on record in 1974. The company beat third quarter profit estimates but gave a much weaker fourth quarter outlook. Our count reads the drop from the June high at $142.34 as an A-B-C correction, with wave (C) targeting about $56.31. The count stays valid while price holds below $92.07. Count date: October 30, 2026.
Key takeaways
- The drop: Intel fell as much as 30% and erased more than $100 billion in market value in one session.
- The reason: fourth quarter revenue guidance of $15 billion to $16 billion missed the roughly $17 billion estimate, as PC demand weakened.
- Wave count: the stock is in wave (C) of a correction from the June high at $142.34, with a target near $56.31.
- Risk line: a move back above $92.07, Thursday’s close, would cancel the bearish count.
Intel was one of the best performing large stocks of 2026, rising from about $37 in January to a high of $142.34 in June. One earnings report has now cut that gain sharply. If you follow chip stocks, compare this move with our AMD wave count.
What Intel reported
The third quarter itself was solid. Revenue rose 21% to $16.5 billion, in line with estimates, and adjusted earnings of $0.52 per share beat the $0.41 forecast. Data center and AI revenue jumped 78% to about $7.3 billion. You can read the company’s filings on SEC EDGAR.

The problem was everything else. PC chip sales fell 5% to $8.1 billion, below the $8.8 billion estimate, and Intel now expects PC shipments to fall about 12% this year and 10% in 2027. Fourth quarter guidance came in at $15 billion to $16 billion in revenue and $0.25 in earnings per share, against estimates near $17 billion and $0.45. An accident at its Israel plant, which killed two employees, will cut about $300 million from fourth quarter revenue.
Bernstein analyst Stacy Rasgon called the outlook “(in a word) terrible” and cut his price target to $75 from $110. Chief executive Lip-Bu Tan said rebuilding Intel “is going to be a multiyear journey.”
How bad was the drop in history
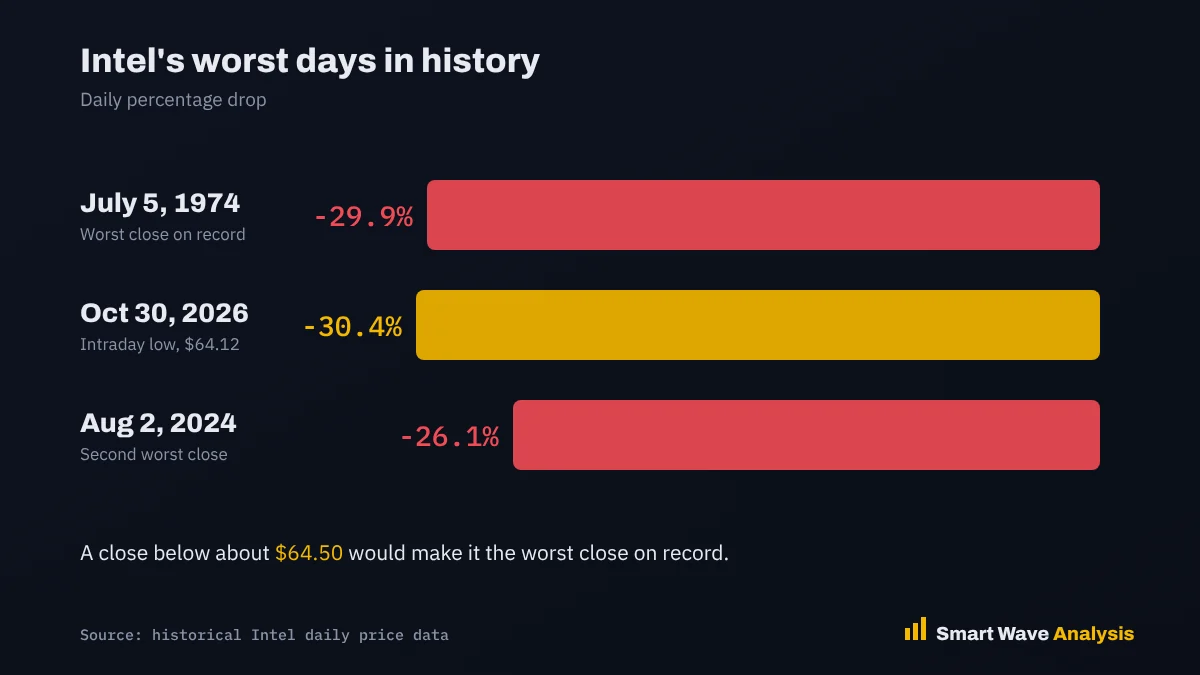
Intel’s two worst closes came on July 5, 1974, when the stock fell nearly 30%, and August 2, 2024, when it dropped about 26%. On October 30, the stock touched $64.12, a drop of about 30.4% from Thursday’s close. A close below about $64.50 would make this the worst day in the company’s history. Even so, the stock is still up more than 70% for the year.
Intel stock Elliott Wave count
The rally from the 52-week low at $32.89 to the June high at $142.34 was a powerful advance. We read the fall since that high as an A-B-C correction:
- Wave (A): the first drop from $142.34 to the July low near $80.
- Wave (B): the recovery into late October, which ended near $92 before the report.
- Wave (C): the gap lower on October 30 that broke below the $80 July low and reached $64.12. Breaking the wave (A) low confirms that wave (C) is underway.
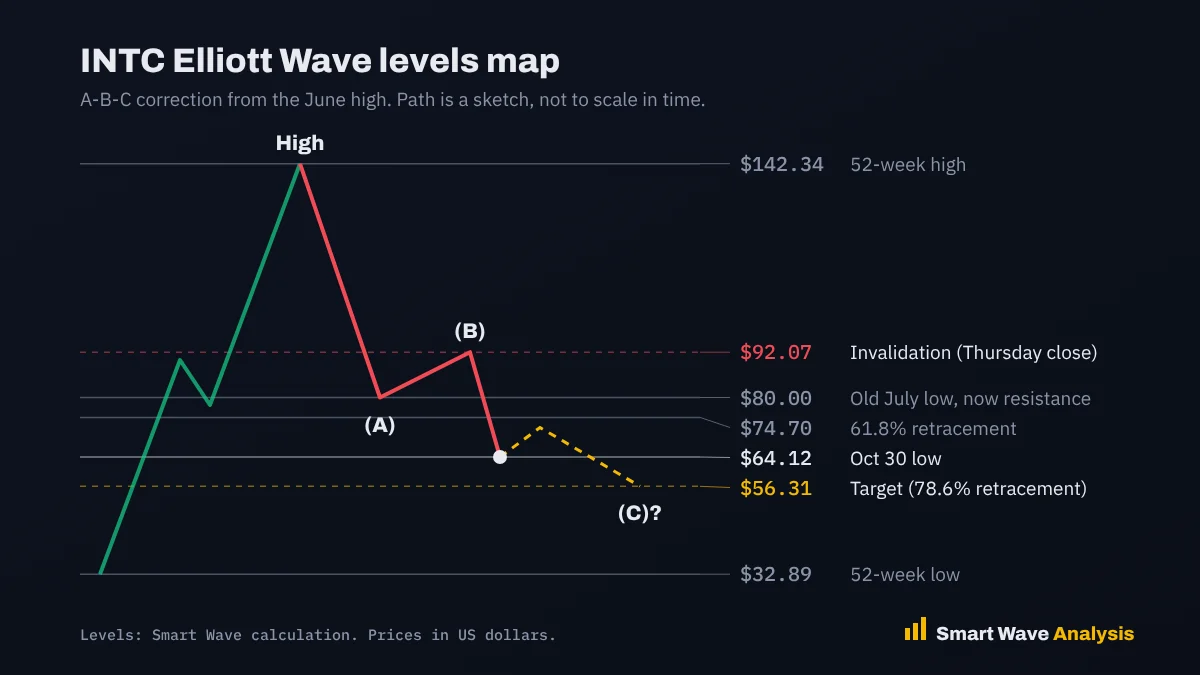
Our target comes from Fibonacci retracements of the full rally from the 52-week low at $32.89 to the high at $142.34. The 61.8% level at $74.70 broke on the gap, and the next level is the 78.6% retracement at $56.31. The $74.70 to $80 area, which was support before, now becomes resistance. You can check these levels with our Fibonacci calculator.
| Level | INTC | Why it matters |
|---|---|---|
| 52-week high | $142.34 | June 2026 high |
| Invalidation | $92.07 | Thursday close and top of the gap |
| Resistance | $74.70 to $80 | 61.8% retracement and the old July low |
| Price | $65.94 | 10:08 a.m. ET, October 30 |
| Day low | $64.12 | Below the record day line intraday |
| Record day line | $64.50 | A close below it is the worst day in Intel’s history |
| Target | $56.31 | 78.6% retracement of the full rally |
How we built this count
We start from the daily chart to mark the 2026 rally and the swings since the June record. Prices come from the US session data for October 30, 2026. Targets use standard Fibonacci retracements of the rally from the 52-week low at $32.89 to the high at $142.34. Every count has one invalidation level. For our earlier view on this stock, read our Intel and Micron Elliott Wave analysis.
Trade plan
- Bearish viewSell bounces into the $74.70 to $80 zone, with a stop above $82. The wider stop sits above $92.07.
- TargetAbout $56.31. Take some profit if price retests the $64.12 low, where buyers stepped in first.
- Gap riskStop orders can fill far from your price when a stock gaps. Read how a stop order works before you use one.
- RiskSize each trade so a stop costs only 1% to 2% of your account. Our position size calculator does the math.
Want the next Intel count before the move?
Get professional Elliott Wave analysis with updated charts, clear targets and invalidation levels for stocks, indices, forex, commodities and crypto.
- Daily chart updates
- Entry and stop levels
- Several timeframes
Frequently asked questions
Why did Intel stock fall 30%?
Intel beat third quarter profit estimates, but guided fourth quarter revenue to $15 billion to $16 billion, well below the roughly $17 billion analysts expected, and fourth quarter EPS to $0.25 versus about $0.45. Weak PC demand and an accident at its Israel plant hurt the outlook.
Is this Intel’s worst day ever?
Intel’s worst close came on July 5, 1974, when it fell nearly 30%. On October 30, 2026, the stock fell as much as 30.4% intraday to $64.12. A close below about $64.50 would make it the worst day in the company’s history.
What is the Intel stock Elliott Wave target?
Our count reads the fall from the June high at $142.34 as an A-B-C correction. Wave (C) targets about $56.31, the 78.6% retracement of the rally from the 52-week low. A move back above $92.07 would cancel the count.
Is Intel still up for the year?
Yes. Intel started 2026 near $37, so even near $66 it is still up more than 70% year to date, though it is less than half its June high.
Sources
This analysis is for education and is not financial advice. Elliott Wave counts are probabilities, not certainties. Read our risk disclaimer.
Free Elliott Wave e-books
 FREE
Elliott Wave Forecasting Guide
A clear introduction to forecasting markets with the Elliott Wave Principle.
Get the free e-book FREE
Elliott Wave Trading Strategies
Practical setups for entries, stops and exits using wave structure.
Get the free e-book FREE
Beginner's Guide to Forex Trading
Forex basics for new traders: pairs, pips, lots, sessions and risk.
Get the free e-book FREE
Guide to Trading Stocks and ETFs
How stock and ETF markets work and how to read them with wave analysis.
Get the free e-bookFree download after a short sign-up with the publisher.
Educational content only. Nothing on this page is financial advice or a recommendation to buy or sell. Trading involves risk and you can lose money. Elliott Wave counts are probabilities, not certainties. Read our full disclaimer and affiliate disclosure.