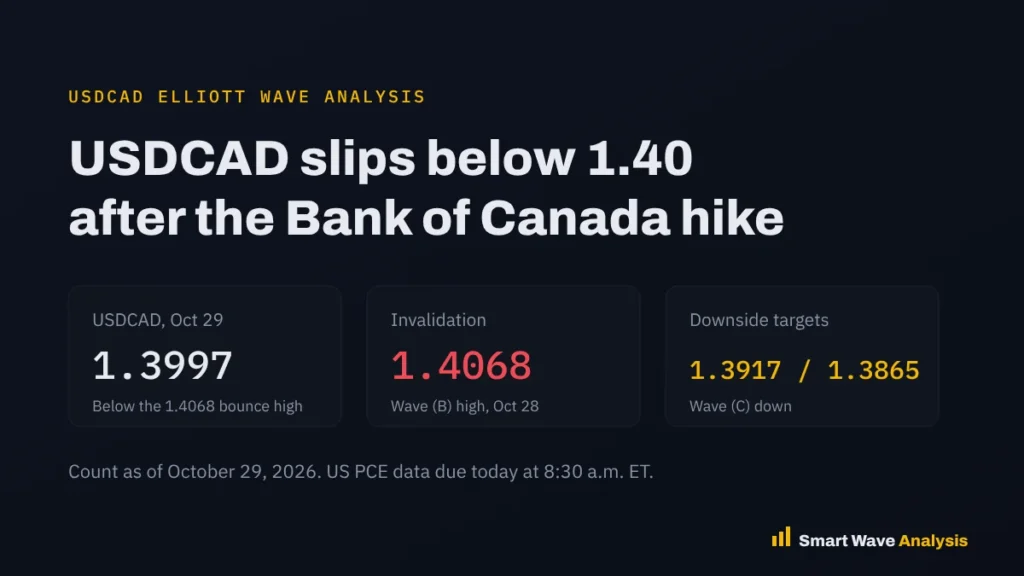
USDCAD trades near 1.3997 on October 29, 2026, after the Bank of Canada raised rates to 2.50% while the Fed held steady. The bounce to 1.4068 failed on the day of the decision. On our chart, the pair is in wave (C) down of an A-B-C decline from the October high. The targets are 1.3917 and 1.3865, and the count stays valid while price holds below 1.4068. Count date: October 29, 2026.
Two central banks met on the same day and went in different directions. The Canadian dollar won that round, and USDCAD dropped back below the 1.40 mark. This post explains the decisions, what they mean for the rate gap, and which levels matter next. You can follow the daily count on our USD/CAD analysis page.
Bank of Canada hikes while the Fed holds
The Bank of Canada raised its overnight rate by 25 basis points to 2.50% on October 28, 2026, ending a run of seven holds, according to the Bank of Canada key interest rate page. It said it acted to stop high energy prices from spreading to other goods and services, and that more increases may be needed. Canadian inflation rose to 3.1% in September, with gasoline up 27.8% from a year earlier.
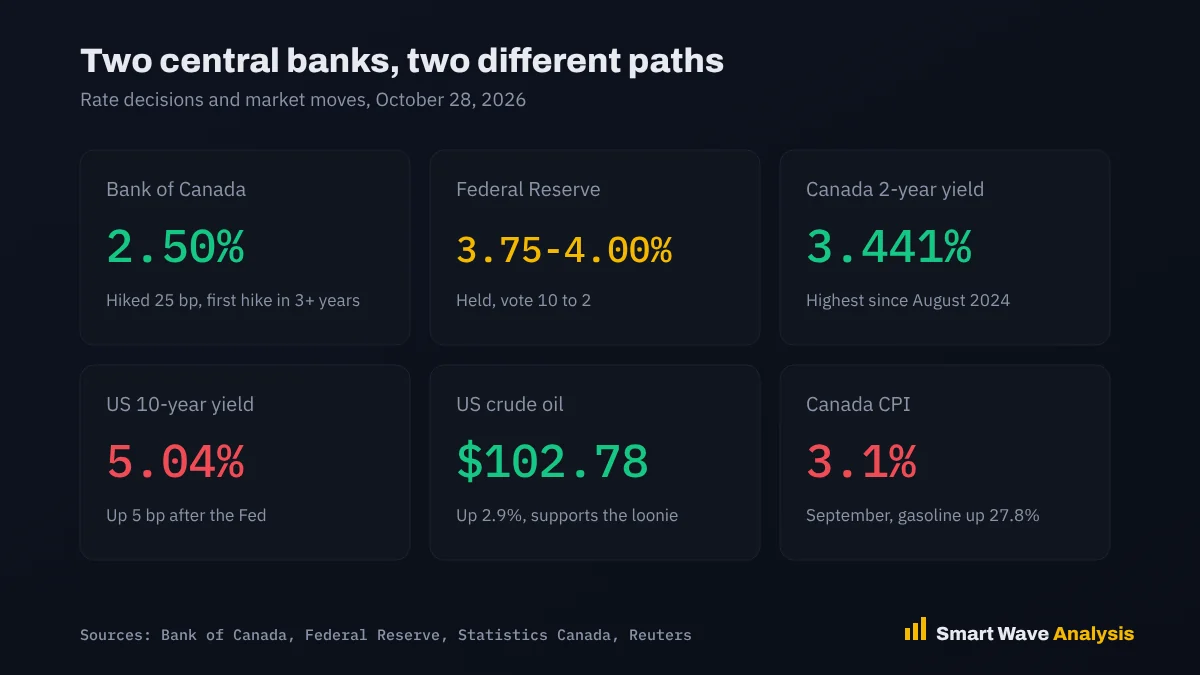
Hours later, the Fed kept its range at 3.75% to 4.00%, based on the Federal Reserve meeting calendar. The vote was 10 to 2, with two members wanting a hike. Fed Chair Kevin Warsh called the meeting “a heck of a family fight.” Markets still price a high chance of a Fed hike in December, but the Bank of Canada moved first.
The bond market reacted fast. Canada’s 2-year yield rose to 3.441%, its highest since August 2024. USDCAD traded between 1.3990 and 1.4068 on the day and broke below 1.40 early on October 29. Higher oil also helped the loonie, with US crude settling at $102.78, up 2.9%. TD Securities strategists said they see “a lower bar for a subsequent hike in December.” Keep our economic calendar open for today’s US PCE data.
USDCAD Elliott Wave count
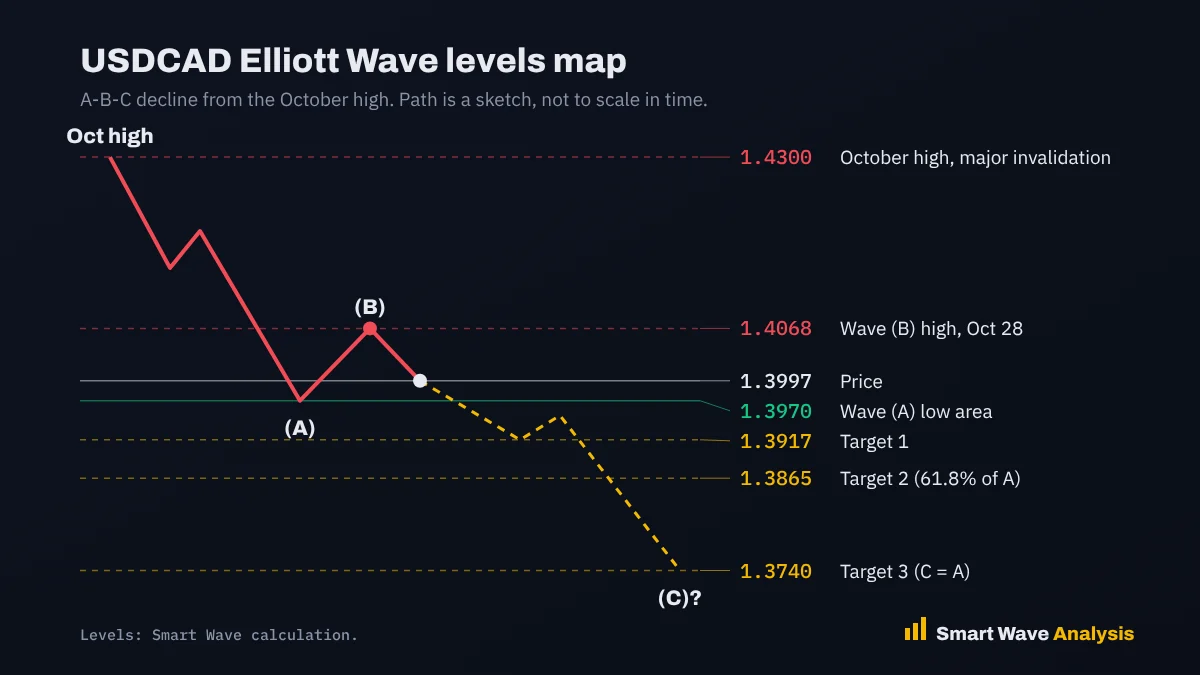
We read the move since the October high near 1.43 as an A-B-C decline, the pattern known as a zigzag:
- Wave (A): the drop from the October high near 1.43 to the late October low area near 1.397.
- Wave (B): the bounce to 1.4068 on October 28, which failed after the Bank of Canada decision.
- Wave (C): the decline from 1.4068 that is now in progress. On the 1-minute chart, the first small leg reached 1.3971, and the current bounce is testing the 1.3999 to 1.4007 area.

A daily close below 1.3970 would confirm that wave (C) is underway. The first target at 1.3917 is the next support on the daily chart. The second target at 1.3865 is where wave (C) would reach 61.8% of wave (A). If selling speeds up, wave (C) equal to wave (A) points to about 1.3740. Read more about this pattern in our zigzag correction lesson.
| Level | USDCAD | Why it matters |
|---|---|---|
| Major invalidation | 1.4300 | October high. Above it, the whole decline is in doubt |
| Invalidation | 1.4068 | Wave (B) high. A move above it cancels wave (C) |
| Resistance | 1.3999 to 1.4007 | Small bounce high on October 29 |
| Price | 1.3997 | October 29, 2026 |
| Trigger | 1.3970 | A daily close below it confirms wave (C) |
| Target 1 | 1.3917 | Next daily support |
| Target 2 | 1.3865 | Wave (C) at 61.8% of wave (A) |
| Target 3 | 1.3740 | Wave (C) equals wave (A) |
Trade plan
- Bearish viewSell bounces toward 1.4000 to 1.4040 while price holds below 1.4068, with a stop above 1.4068.
- Targets1.3917 first, then 1.3865. Keep a small part for 1.3740 if the decline speeds up.
- Event riskUS PCE inflation and GDP come out today at 8:30 a.m. ET. A hot reading could lift the US dollar for a few hours.
- RiskSize each trade so a stop costs only 1% to 2% of your account. Our position size calculator does the math.
Want the next USDCAD count before the move?
Get professional Elliott Wave analysis with updated charts, clear targets and invalidation levels for stocks, indices, forex, commodities and crypto.
- Daily chart updates
- Entry and stop levels
- Several timeframes
Frequently asked questions
Why did USDCAD fall below 1.40?
The Bank of Canada raised its key rate by 25 basis points to 2.50% on October 28, 2026, its first hike in more than three years. The Fed held rates the same day, so the rate gap moved in favor of the Canadian dollar.
What is the USDCAD Elliott Wave target?
Our count shows USDCAD in wave (C) of an A-B-C decline from the October high. The targets are 1.3917 and 1.3865, with 1.3740 if wave (C) equals wave (A). A move above 1.4068 would cancel the count.
Will the Bank of Canada hike again in December?
The Bank of Canada said more increases may be needed. Swap markets priced about a 45% chance of another hike at the December 9, 2026 decision.
How does oil affect the Canadian dollar?
Canada is a large oil exporter, so higher oil prices usually support the Canadian dollar. US crude settled at $102.78 on October 28, up 2.9%, which added to the loonie’s strength.
Sources
This analysis is for education and is not financial advice. Elliott Wave counts are probabilities, not certainties. Read our risk disclaimer.
Free Elliott Wave e-books
 FREE
Elliott Wave Forecasting Guide
A clear introduction to forecasting markets with the Elliott Wave Principle.
Get the free e-book FREE
Elliott Wave Trading Strategies
Practical setups for entries, stops and exits using wave structure.
Get the free e-book FREE
Beginner's Guide to Forex Trading
Forex basics for new traders: pairs, pips, lots, sessions and risk.
Get the free e-book FREE
Guide to Trading Stocks and ETFs
How stock and ETF markets work and how to read them with wave analysis.
Get the free e-bookFree download after a short sign-up with the publisher.
Educational content only. Nothing on this page is financial advice or a recommendation to buy or sell. Trading involves risk and you can lose money. Elliott Wave counts are probabilities, not certainties. Read our full disclaimer and affiliate disclosure.