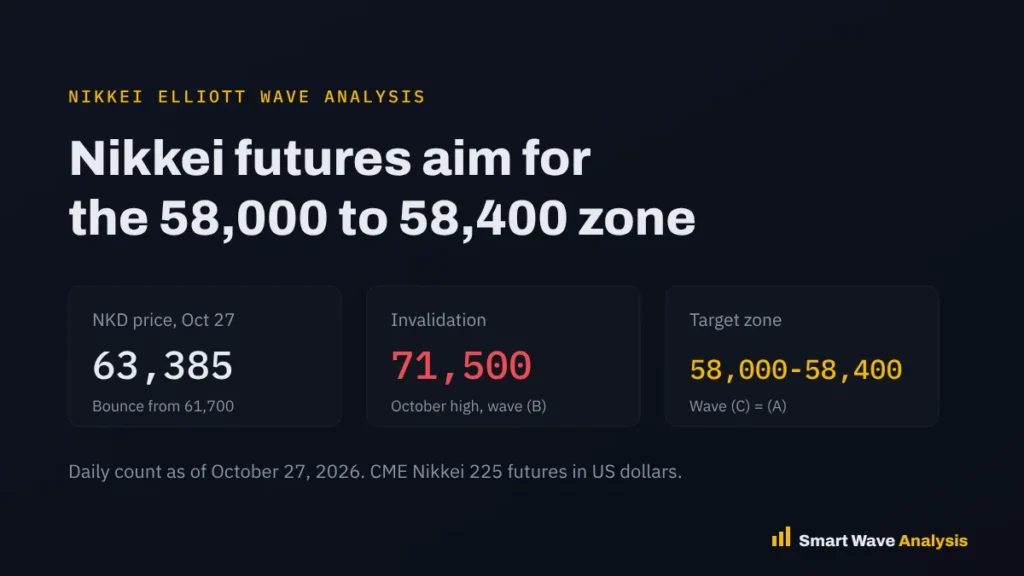
Nikkei 225 futures (NKD) trade near 63,385 after bouncing from about 61,700. On our daily chart, the index is in wave (C) down of an A-B-C correction from the June record high near 73,800. After a short bounce, our target zone is 58,000 to 58,400, and the bearish count stays valid while price holds below 71,500. Count date: October 27, 2026.
Japanese stocks had a record run in the first half of 2026, and the Nikkei 225 closed above 72,000 for the first time in June. Since then, the index has moved in a wide range, and October brought one of its sharpest drops on record. This post explains what is driving the move and where the next support sits. You can follow the live count on our Nikkei 225 analysis page.
Why Japanese stocks fell in October 2026
The Nikkei 225 fell 4.9% on October 15, its third-largest point drop on record. Selling in AI stocks spread to Japan’s chip makers, and Bank of Japan Policy Board member Koeda said the bank should not become too cautious about raising its 1.25% policy rate while financial conditions stay loose.
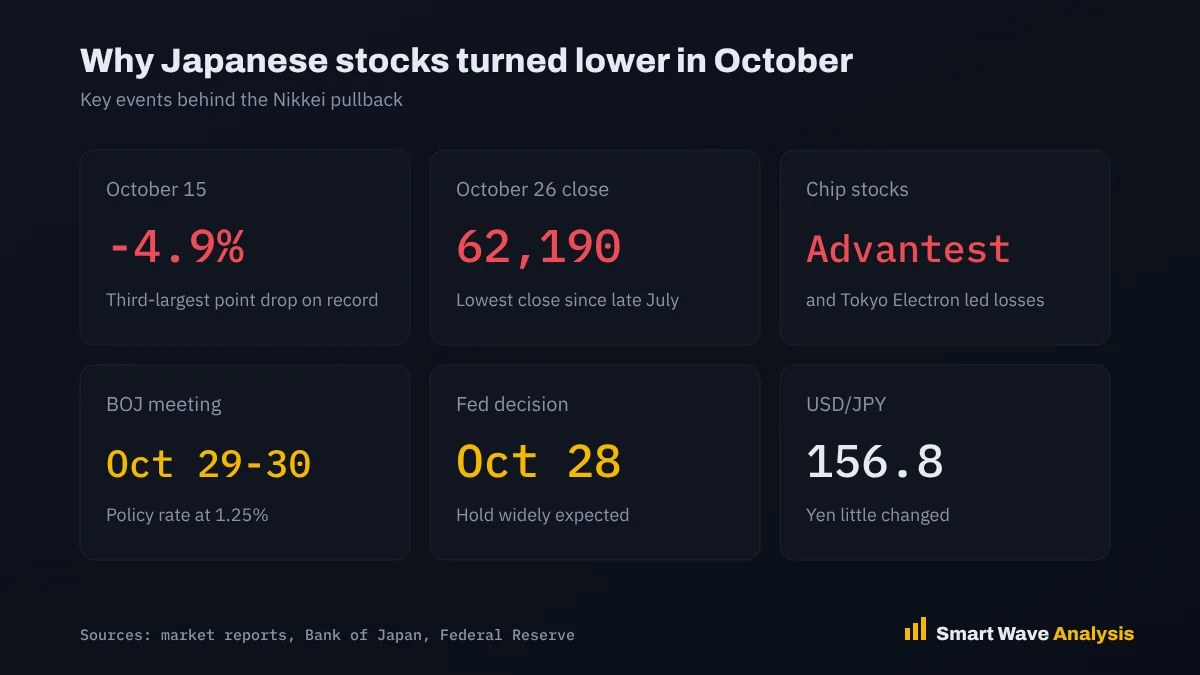
The pressure did not stop there. On October 26, the Nikkei closed down 0.80% at 62,189.65, its lowest close since late July and its third straight loss. Advantest and Tokyo Electron were the biggest drags, while energy names such as Inpex and the large trading houses rose.
What to watch this week: the Fed and the Bank of Japan
Two central bank decisions arrive back to back. The Federal Reserve announces its decision on October 28, according to the Federal Reserve meeting calendar, and markets broadly expect a hold.
The Bank of Japan meets on October 29 and 30 and releases its quarterly Outlook Report on the second day, based on the Bank of Japan meeting schedule. A rate hike or strong hints of one would likely lift the yen, which usually hurts Japanese exporters and the Nikkei. The dollar traded near 156.8 yen on October 26. See our USD/JPY wave count for the currency side.
Nikkei Elliott Wave count
The chart below shows CME Nikkei 225 futures in US dollars on the daily timeframe, with our wave labels. We read the move since the June high near 73,800 as an A-B-C correction:
- Wave (A): the first drop from about 73,800 in late June to about 60,700 in late July, a fall of about 13,100 points.
- Wave (B): a three-wave bounce: up to about 69,700 in August (a), down to about 62,600 in September (b), and up to about 71,500 in early October (c). It recovered about 82% of wave (A) but stayed below the June high.
- Wave (C): the decline from 71,500 that is now in progress. The first leg, wave (1), reached about 61,700. The current bounce is likely wave (2).

Our main target comes from a common Fibonacci relationship: wave (C) often equals wave (A). A drop of 13,100 points from 71,500 gives about 58,400. The 61.8% retracement of the whole rally from the November 2025 low near 48,300 sits close by, near 58,040, which makes 58,000 to 58,400 a strong support zone. You can check both numbers with our Fibonacci calculator.
| Level | NKD price | Why it matters |
|---|---|---|
| Invalidation | 71,500 | Wave (B) high. A move above it cancels the count |
| Bounce zone | 65,400 to 66,600 | 38.2% to 50% retracement of wave (1), where wave (2) may end |
| Price | 63,385 | October 27, 2026 |
| Support | 61,700 | Wave (1) low. A break below it starts wave (3) |
| Target zone | 58,000 to 58,400 | Wave (C) equals (A), plus the 61.8% retracement |
| Extension | 55,300 | Wave (C) at 123.6% of wave (A), if selling speeds up |
Trade plan
- Bearish viewWait for the bounce to reach the 65,400 to 66,600 zone, then look to sell with a stop above 67,800. The wider stop for a swing trade sits above 71,500.
- Targets61,700 first, then the 58,000 to 58,400 zone. Take some profit at each step.
- Event riskThe Fed on October 28 and the Bank of Japan on October 30 can move the yen and the Nikkei sharply. Keep positions small around those dates.
- RiskSize each trade so a stop costs only 1% to 2% of your account. Our position size calculator does the math.
Want the next Nikkei count before the move?
Get professional Elliott Wave analysis with updated charts, clear targets and invalidation levels for stocks, indices, forex, commodities and crypto.
- Daily chart updates
- Entry and stop levels
- Several timeframes
Frequently asked questions
Why is the Nikkei falling in October 2026?
Japanese stocks fell as selling in AI and chip stocks spread to Tokyo and as a Bank of Japan board member argued for more rate hikes. The Nikkei 225 dropped 4.9% on October 15 and closed at 62,189.65 on October 26, its lowest close since late July.
What is the Nikkei Elliott Wave target?
Our daily count shows Nikkei futures in wave (C) of an A-B-C correction from the June record high. The target zone is 58,000 to 58,400, where wave (C) equals wave (A) and the 61.8% retracement of the rally from November 2025 sits.
What would cancel the bearish Nikkei count?
A move above 71,500, the October high and the end of wave (B), would cancel the count. A daily close above 66,600 would be the first warning.
When is the next Bank of Japan meeting?
The Bank of Japan holds its policy meeting on October 29 and 30, 2026, and releases its quarterly Outlook Report on October 30. The Fed announces its decision a day earlier, on October 28.
Sources
This analysis is for education and is not financial advice. Elliott Wave counts are probabilities, not certainties. Read our risk disclaimer.
Free Elliott Wave e-books
 FREE
Elliott Wave Forecasting Guide
A clear introduction to forecasting markets with the Elliott Wave Principle.
Get the free e-book FREE
Elliott Wave Trading Strategies
Practical setups for entries, stops and exits using wave structure.
Get the free e-book FREE
Beginner's Guide to Forex Trading
Forex basics for new traders: pairs, pips, lots, sessions and risk.
Get the free e-book FREE
Guide to Trading Stocks and ETFs
How stock and ETF markets work and how to read them with wave analysis.
Get the free e-bookFree download after a short sign-up with the publisher.
Educational content only. Nothing on this page is financial advice or a recommendation to buy or sell. Trading involves risk and you can lose money. Elliott Wave counts are probabilities, not certainties. Read our full disclaimer and affiliate disclosure.