
Gold (XAUUSD) trades near $4,053 on October 28, 2026, after bouncing from the October 23 low at $3,975. Our count reads this rise as a three-wave bounce inside a bigger decline. Wave (C) of the bounce could reach the 4,100 to 4,125 zone, after which we expect the decline to resume toward 3,975 and then 3,900. A move above 4,160 would cancel this view. Count date: October 28, 2026.
Gold set a record near $5,590 an ounce on January 28, 2026, and has been correcting since. At about $4,053, it is roughly 27% below that peak. This week brings a Fed decision and fresh inflation data, so the next move could be sharp. You can follow the live count on our gold analysis page.
Why the gold price is under pressure
Oil is the main reason. Brent crude jumped to about $115.59 after an attack on a Saudi refinery, and higher energy prices feed inflation. That makes it more likely that interest rates stay high for longer, which hurts gold because it pays no interest. Hamad Hussain of Capital Economics said oil gains are weighing on gold because of the Fed taking a more hawkish stance than markets expect. See our Brent crude wave count for the oil side.
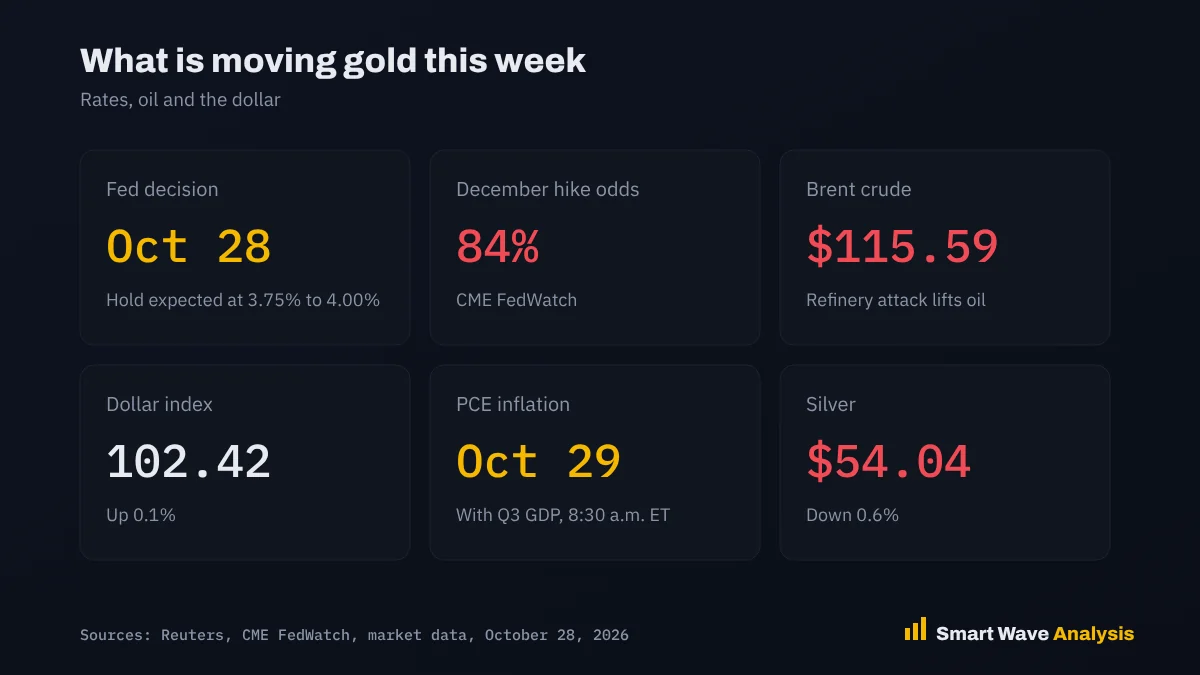
Gold fell below $4,000 on October 23 for the first time since mid-July, touching $3,975.23. It bounced about 1% on October 27, but slipped again on October 28 ahead of the Fed. A Reuters survey also showed analysts cut their 2026 gold forecasts for a second quarter in a row, citing high Treasury yields and a strong dollar.
What to watch: the Fed and PCE inflation
The Fed announces its rate decision on Wednesday, October 28, at 2 p.m. ET, based on the Federal Reserve meeting calendar. Markets expect a hold at 3.75% to 4.00%, after the September meeting delivered the first rate increase in three years. CME FedWatch data shows an 84% chance of another hike in December.
On Thursday, October 29, at 8:30 a.m. ET, the US releases September PCE inflation and third quarter GDP, according to the Bureau of Economic Analysis release schedule. A soft PCE reading could help gold rally, while a hot one would support the sell zone view. Keep our economic calendar open for exact times.
Gold Elliott Wave count
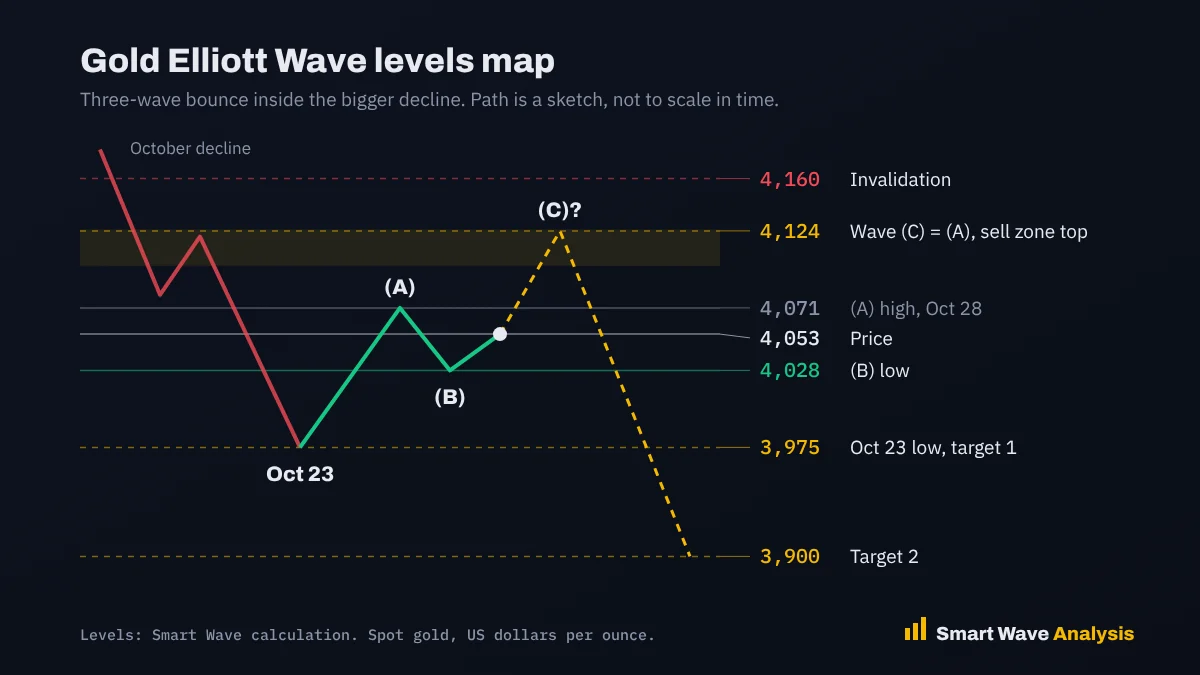
The bigger trend since the January record is down. The latest leg took gold to 3,975 on October 23. We read the rise since then as a three-wave bounce, not the start of a new uptrend:
- Wave (A): the rally from 3,975 to about 4,071 early on October 28.
- Wave (B): the pullback to about 4,028 later that morning, which gave back about 45% of wave (A).
- Wave (C): the rise from 4,028 that is now in progress. A break above 4,071 would confirm it.

Wave (C) often equals wave (A). Wave (A) measured about 96 dollars, so the same move from 4,028 points to about 4,124. That level sits right at the 20-day average near 4,125, which makes 4,100 to 4,125 a strong sell zone. Learn how this pattern works in our zigzag correction lesson.
| Level | XAUUSD | Why it matters |
|---|---|---|
| Invalidation | 4,160 | Wave (C) at 138.2% of wave (A). Above it, the bounce is more than a correction |
| Sell zone | 4,100 to 4,125 | Wave (C) equals (A), and the 20-day average |
| Wave (A) high | 4,071 | A break above confirms wave (C) |
| Price | 4,053 | October 28, 2026 |
| Wave (B) low | 4,028 | A break below means the bounce is already over |
| Target 1 | 3,975 | October 23 low |
| Target 2 | 3,900 | Round number support below the October low |
Trade plan
- Bearish viewLook to sell in the 4,100 to 4,125 zone, with a stop above 4,160. Do not sell before the Fed decision, since the first move after it can be very fast.
- Targets3,975 first, then 3,900. Take some profit at the first target.
- Bullish caseOnly if gold closes above 4,160. Then the target is the 4,220 area.
- RiskSize each trade so a stop costs only 1% to 2% of your account. Our position size calculator does the math.
Want the next gold count before the move?
Get professional Elliott Wave analysis with updated charts, clear targets and invalidation levels for stocks, indices, forex, commodities and crypto.
- Daily chart updates
- Entry and stop levels
- Several timeframes
Frequently asked questions
Why is the gold price falling in October 2026?
Higher oil prices are raising fears of higher-for-longer interest rates, and markets price an 84% chance of a Fed rate hike in December. Higher rates make gold, which pays no interest, less attractive. Gold fell below $4,000 on October 23 for the first time since mid-July.
What is the gold Elliott Wave outlook?
Our count reads the rise from the October 23 low at 3,975 as a three-wave bounce. Wave (C) may reach the 4,100 to 4,125 zone, after which the decline could resume toward 3,975 and then 3,900. A move above 4,160 would cancel this view.
How far is gold from its record high?
Spot gold set a record near $5,590 per ounce on January 28, 2026. At about $4,053, it trades roughly 27% below that peak.
What events could move gold this week?
The Fed decision on October 28 at 2 p.m. ET, followed by the press conference, and the September PCE inflation and third quarter GDP data on October 29 at 8:30 a.m. ET.
This analysis is for education and is not financial advice. Elliott Wave counts are probabilities, not certainties. Read our risk disclaimer.
Free Elliott Wave e-books
 FREE
Elliott Wave Forecasting Guide
A clear introduction to forecasting markets with the Elliott Wave Principle.
Get the free e-book FREE
Elliott Wave Trading Strategies
Practical setups for entries, stops and exits using wave structure.
Get the free e-book FREE
Beginner's Guide to Forex Trading
Forex basics for new traders: pairs, pips, lots, sessions and risk.
Get the free e-book FREE
Guide to Trading Stocks and ETFs
How stock and ETF markets work and how to read them with wave analysis.
Get the free e-bookFree download after a short sign-up with the publisher.
Educational content only. Nothing on this page is financial advice or a recommendation to buy or sell. Trading involves risk and you can lose money. Elliott Wave counts are probabilities, not certainties. Read our full disclaimer and affiliate disclosure.