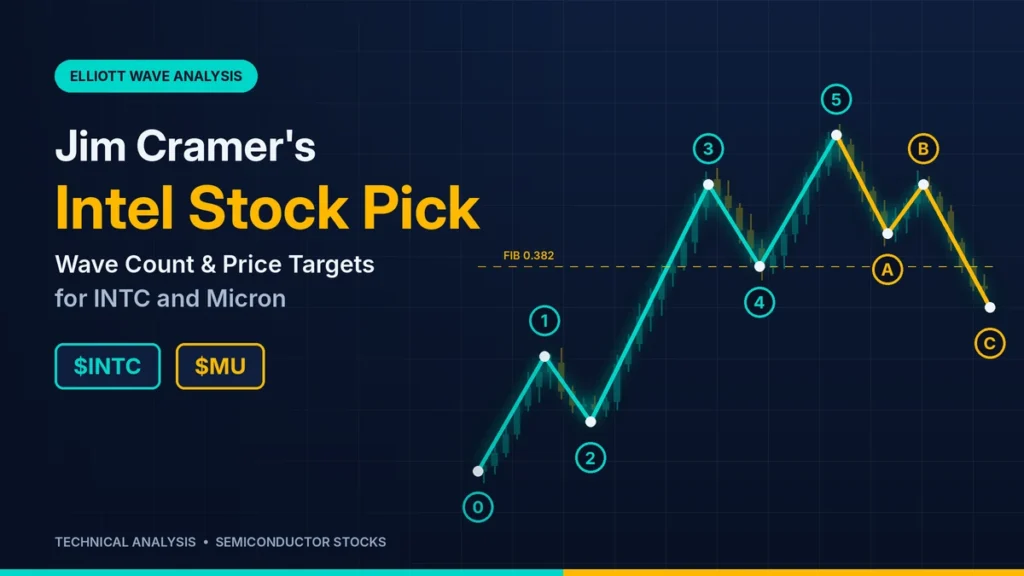
Quick answer: On the September 17 Mad Money, Jim Cramer called Intel (INTC) “the best stock in show” and ranked Micron (MU) second. Both stocks now sit inside Fibonacci retracement zones of their summer declines. Our working count treats each rally as a correction using Elliott Wave analysis, invalid above $142.35 for Intel and above $1,255 for Micron.
What Jim Cramer Said About Intel and Micron
The Sept 17 Mad Money call
Cramer said both companies’ products are in short supply and that he had just bought some Micron. One day earlier, he warned that buying stocks after the Fed’s first rate hike in three years means fighting the Fed. The Fed raised its rate by a quarter point to a range of 3.75% to 4%. On Sept. 17, Intel closed up 7.67% and Micron up 5.50%.
The Sept. 18 options flow post
Cramer posted on X that someone bought more than $90 million of October 2 calls: Intel at $115 ($3.8 million), Micron at $1,000 ($44 million), SanDisk at $1,600 ($41 million) and Marvell at $250 ($3.8 million). Benzinga said the buyer is unconfirmed.
This unusual options flow activity attracted attention from traders following technical analysis signals and broader market momentum.
Cramer’s stance since July
Closing prices come from S&P Global Market Intelligence data.
| Date | Cramer’s position | INTC | MU |
|---|---|---|---|
| Jul 20 to 21 | Urged trimming oversized tech positions, then named Micron, Applied Materials, Intel and AMD as favorites | $105.45 | $970.82 |
| Aug 17 | Said memory stocks had more room, saw Micron doubling again, and his Charitable Trust opened a Micron stake | $103.49 | $1,011.75 |
| Sep 16 | Warned that buying after the rate hike means fighting the Fed | $101.05 | $926.55 |
| Sep 17 | Intel best in show, Micron second | $108.80 | $977.50 |
| Sep 18 | Flagged October 2 call buying | $108.60 | $1,015.80 |
The Fundamentals Behind the Call
Intel: Q2 results, Foundry losses, and the 14A timeline
Intel’s Q2 revenue rose 25% to $16.1 billion, and Data Centre and AI revenue climbed 59% to $6.3 billion. A $12.5 billion mark-to-market charge on escrowed shares tied to the U.S. government agreement produced an $11 billion GAAP net loss. Intel Foundry lost $2.1 billion, and only about 5% of its revenue came from outside customers.
On Sept. 17, TipRanks reported that Intel pulled 14A risk production into Q1 2027, and shares rose nearly 10% intraday. Intel told Wccftech its guidance is unchanged: risk production for internal products in the second half of 2027, volume production in Q1 2028. Treat company guidance as the base case. SK hynix said nothing is finalized on reported talks to make memory chips at Intel’s Ohio site, and Intel declined to comment.
Micron: 80.4% operating margin and tight DRAM supply
For the quarter ended May 28, Micron posted a GAAP operating margin of 80.4%, against 23.3% a year earlier. Revenue was $41.46 billion versus $9.30 billion, and management guided fiscal Q4 revenue to $50.0 billion, plus or minus $1.0 billion, at roughly 86% gross margin. Operating cash flow was $25.4 billion against $7.1 billion of capital spending. Sixteen strategic customers have committed $22 billion in deposits and related commitments, with take-or-pay terms and price floors. Intel CEO Lip-Bu Tan said on Sept. 15 that memory prices have risen five to seven times. Micron Technology, Inc. – Micron Technology, Inc. Reports Record Results for the Third Quarter of Fiscal 2026 +4
🚀 Don’t Miss the Next Move
Get daily Elliott Wave counts, live chart updates, and high-probability trade setups across crypto, forex, and stocks — before the market moves.
👉 Start Your 14-Day Trial for Just $0.99 →Cancel anytime. No long-term commitment. (Affiliate link — we may earn a commission at no extra cost to you.)
The bear case for both stocks
Intel’s Foundry still loses money, and the stock trades near 8.2 times sales. Micron’s earnings are exposed to any softening in memory pricing, and it is spending heavily to add capacity. Memory makers have historically overbuilt into booms, a pattern Cramer argues has changed. Michael Burry reportedly shorted Micron near $1,052 in early July. Rates add pressure, with the 10 year Treasury yield back at 5% after the Fed hike. Can Intel’s AI Profits Outrun Its Factory Losses? +4
Intel (INTC) Elliott Wave Analysis
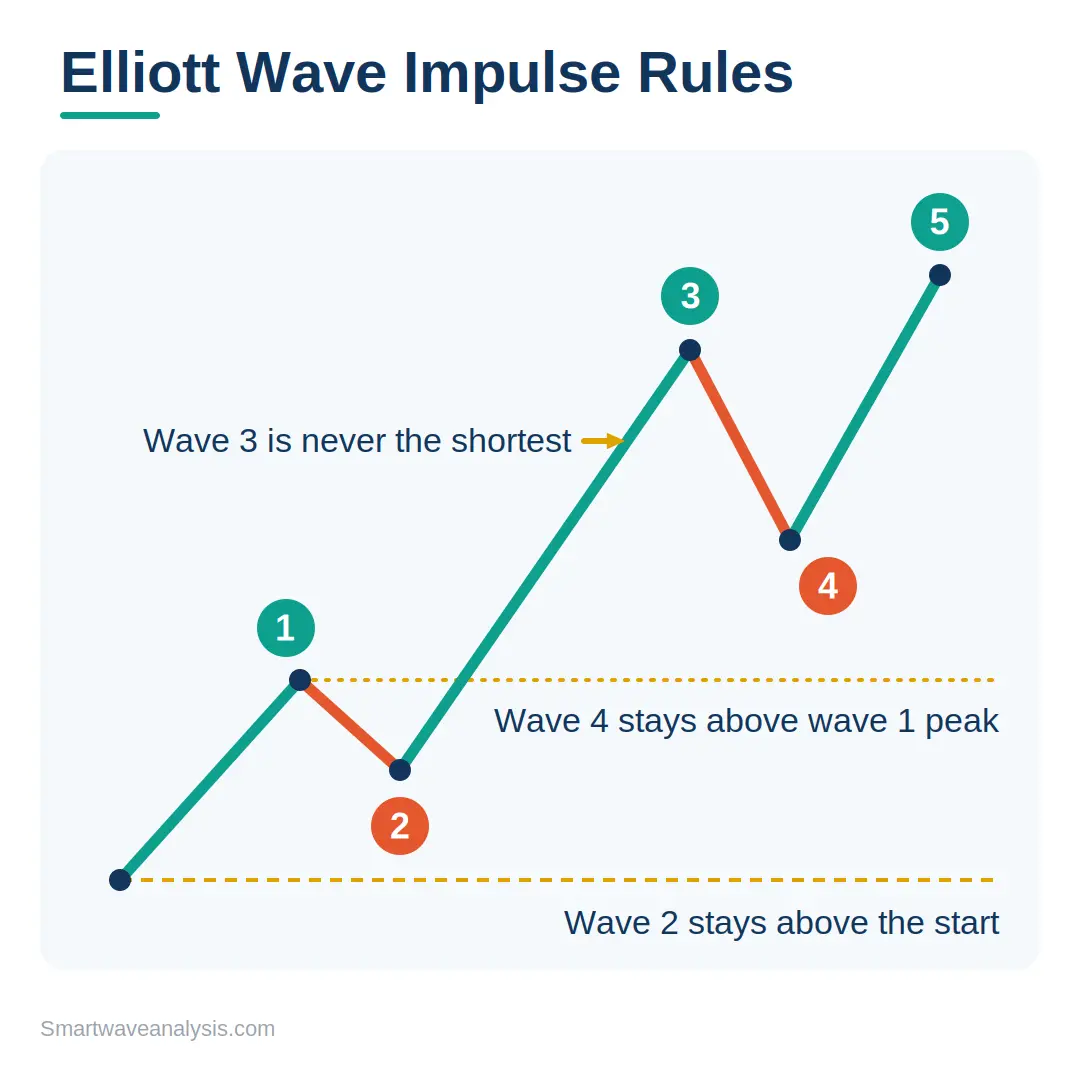
Levels use daily highs and lows from S&P Global data. Impulse rules apply: wave 2 cannot retrace more than 100% of wave 1, wave 3 cannot be the shortest, and wave 4 cannot overlap wave 1.
Working count
Intel peaked at $142.35 on June 30 and bottomed at $81.79 on July 29, a 42.5% decline that we label wave A. The rally since is a candidate for wave B. Intel printed higher lows at $85.14 on Aug 24 and $85.72 on Sept 1, then reached $111.37 on Sept 17. Check out Intel Corp’s stock price (INTC) in real time +2
Fibonacci levels and the invalidation level
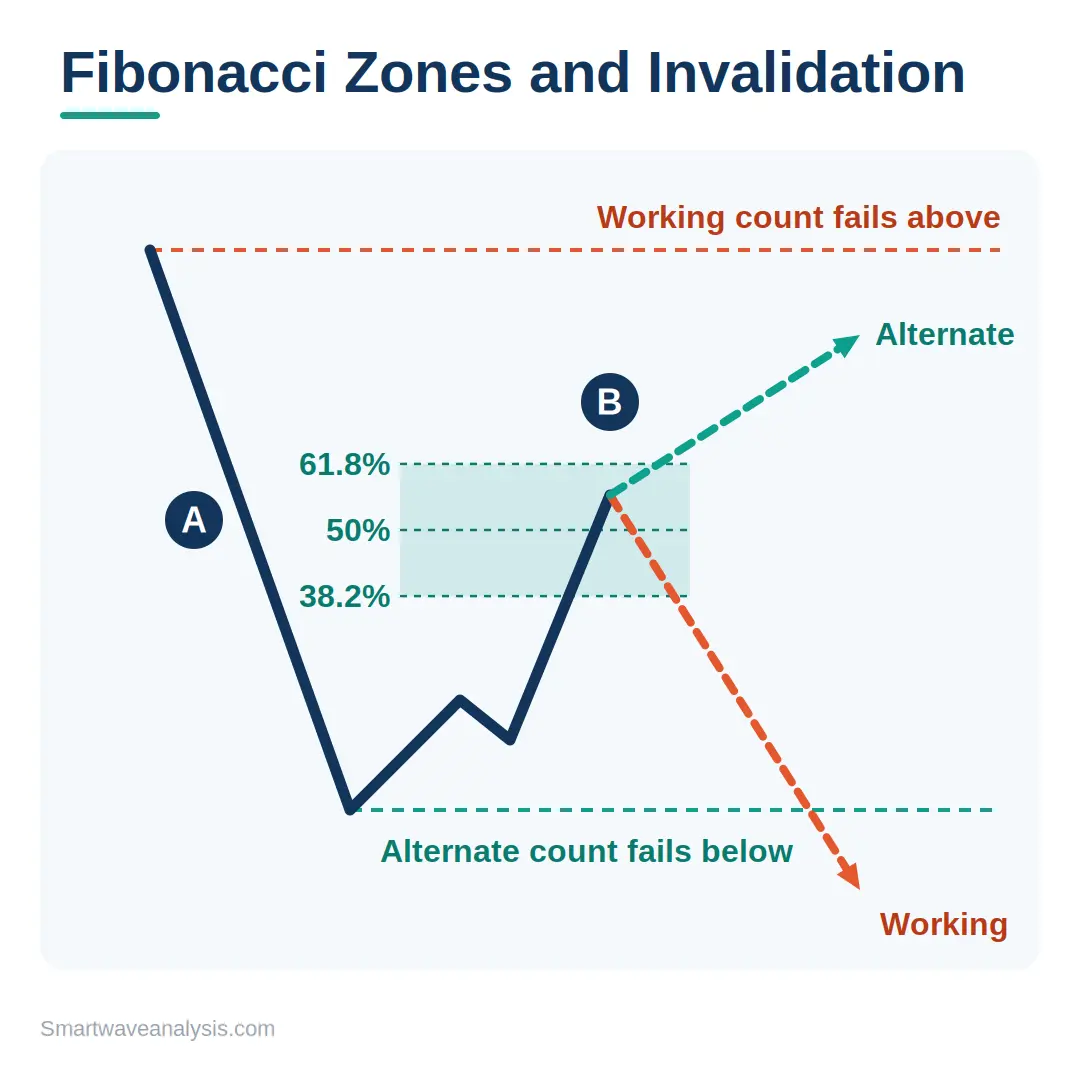
Retracements of the $142.35 to $81.79 decline sit at $104.92 (38.2%), $112.07 (50%) and $119.22 (61.8%). The $108.60 close lies between the first two, and the Sept 17 high stopped $0.70 below the 50% level. A zigzag’s wave B stays below 100% of wave A, so a close above $142.35 invalidates this count.
Alternate count
The July 29 low ended the correction and began wave 1 of a new advance. Wave 2 then cannot fall below $81.79, and a break there ends this reading. The higher lows fit it.
Micron (MU) Elliott Wave Analysis
Working count
Micron’s all-time high was $1,255.00 on June 25. The July 29 low of $737.88 marks a 41.2% decline, which we label wave A. Since mid-August, Micron has stalled three times just above $1,036, with highs of $1,036.13 on Aug 17, $1,041.07 on Sept 8 and $1,042.40 on Sept 9. Check out Micron Technology, Inc.’s stock price (MU) in real time +2
Fibonacci levels and the invalidation level
Retracements of the $1,255 to $737.88 decline sit at $935.42 (38.2%), $996.44 (50%) and $1,057.46 (61.8%). The $1,015.80 close lies between the last two, and all three highs stayed below the 61.8% level. A close above $1,255 invalidates the count.
Alternate count
The July 29 low began a new advance. Wave 2 cannot fall below $737.88, and a break there ends this reading. A close above $1,057.46 would add weight to it.
What the October 2 Call Options Show
Strike price vs current price
| Contract | Strike | Sept 18 close | Distance | Reported premium |
|---|---|---|---|---|
| INTC calls | $115 | $108.60 | 5.9% above the price | $3.8 million |
| MU calls | $1,000 | $1,015.80 | 1.6% below the price, in the money | $44 million |
Intel options volume topped 1.3 million contracts on Sept. 17, nearly triple its 30-day average, with $231 million of $320 million in premium tied to calls, per CNBC.
What short-dated calls can and cannot tell you
Reported premium shows size, not intent. Volume cannot say whether a trader opened or closed a position, or hedged shares. Next day open interest helps confirm new positions. A buyer’s maximum loss is the premium, and calls expiring in two weeks lose time value each day the stock stays flat.
Micron’s earnings date vs expiration
Micron reports fiscal Q4 on Sept 30, two days before the Oct 2 expiration. The $50 billion revenue guide sets the bar, so these calls are largely an earnings bet.
Hedge Funds, Insiders, and Short Interest
13F holdings
Hedge funds holding Intel rose to 138 in Q2 from 112 in Q1, and funds holding Micron rose to 184 from 154. 13F data reflects June 30 positions, so it predates the July lows.
Form 4 insider activity
CEO Lip-Bu Tan bought 105,263 shares at $95.00 on Aug 11, about $10 million. Two executives sold in May at $99.53 and $118.28.
Short interest
Short interest is about 3.0% to 3.3% of Intel’s float and about 2.6% of Micron’s.
How the Signals Line Up
| Signal | Reading |
|---|---|
| Cramer | Bullish since Sept 17 |
| Options flow | Bullish, heavy Intel call volume |
| Hedge fund counts | Rising for both |
| Insider buying | CEO bought at $95, below the current price |
| Analysts | Intel consensus: Hold, average target $117.56; Micron average target $1,513.11 |
| Macro | Headwind from the rate hike and a 5% 10 year yield |
| Wave structure | Unresolved, both inside retracement zones |
Sentiment and flow lean bullish. Structure and macro have not confirmed.
Intel vs Micron Relative Strength
From the July 29 lows, Intel is up 32.8% and Micron 37.7%. From their highs, Intel is down 23.7% and Micron 19.1%. Micron has retraced 53.7% of its decline and Intel 44.3%.
Scenarios and Risk Levels
| Ticker | Bull | Base | Bear |
|---|---|---|---|
| INTC | Close above $112.07, then $119.22 | Range from $104.92 to $112.07 | Close below $104.92, then the $85 area |
| MU | Close above $1,057.46 | Range from $996.44 to $1,057.46 | Close below $935.42, then $737.88 |
Levels are reference points, not forecasts. Size positions for volatility: Intel fell 7.89% on Jul 24 and rose 10.84% on Aug 4, while Micron fell 9.94% on Jul 29 and rose 18.36% the next day.
Frequently Asked Questions
What did Jim Cramer say about Intel and Micron?
On Sept 17, he named Intel his best stock on the show and Micron second, said both products are in short supply, and said he had just bought Micron.
Why is Micron’s operating margin so high?
Tight DRAM supply lifted prices. GAAP operating margin reached 80.4% in fiscal Q3, up from 23.3% a year earlier.
Is Intel Foundry profitable?
No. It lost $2.1 billion in Q2, and about 5% of its revenue came from outside customers.
What invalidates the Intel and Micron wave counts?
The working counts fail above $142.35 for Intel and $1,255 for Micron. The alternate counts fail below $81.79 and $737.88.
What options did Cramer flag?
October 2 calls on Intel at $115, Micron at $1,000, SanDisk at $1,600 and Marvell at $250.
When does Micron report earnings?
September 30, two days before the Oct 2 expiration.
Free Elliott Wave e-books
 FREE
Elliott Wave Forecasting Guide
A clear introduction to forecasting markets with the Elliott Wave Principle.
Get the free e-book FREE
Elliott Wave Trading Strategies
Practical setups for entries, stops and exits using wave structure.
Get the free e-book FREE
Beginner's Guide to Forex Trading
Forex basics for new traders: pairs, pips, lots, sessions and risk.
Get the free e-book FREE
Guide to Trading Stocks and ETFs
How stock and ETF markets work and how to read them with wave analysis.
Get the free e-bookFree download after a short sign-up with the publisher.
Educational content only. Nothing on this page is financial advice or a recommendation to buy or sell. Trading involves risk and you can lose money. Elliott Wave counts are probabilities, not certainties. Read our full disclaimer and affiliate disclosure.