By the Smart Wave Analysis team. Published November 5, 2026. Prices as of 07:34 UTC.
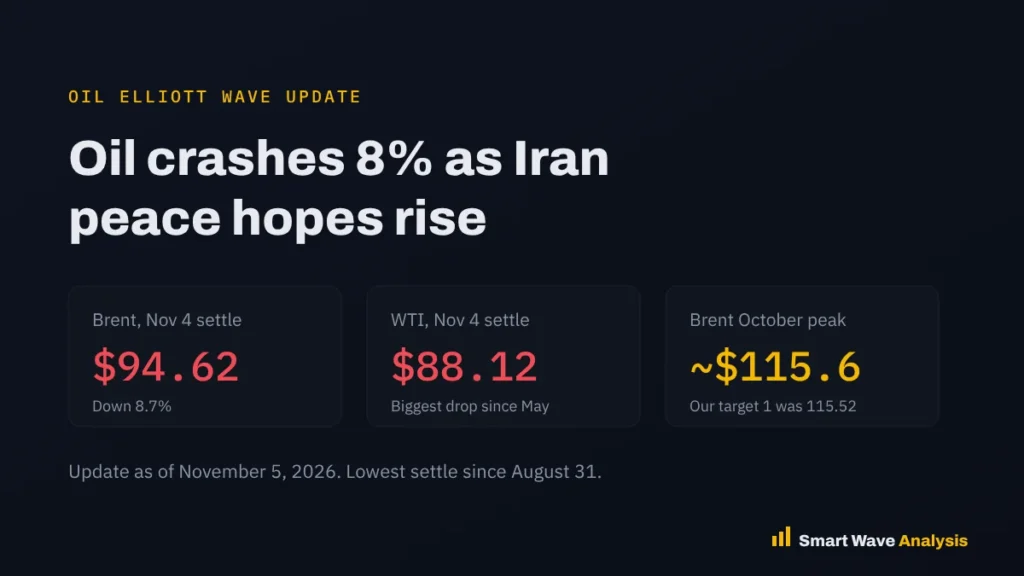
Oil prices crashed on November 4, 2026. Brent settled at $94.62, down 8.7%, and WTI settled at $88.12, down 8.3%, on hopes for a faster end to the Iran conflict. On October 22 our Brent count targeted 115.52 first. Brent peaked near 115.6 on October 28, then reversed. We now read the fall as a correction of the August to October rally, with targets at 92.40 and 86.10. A move above 101.30 would weaken this view.
Key takeaways
- The crash: Brent and WTI fell more than 8% in one session to their lowest settles since August 31.
- The reason: US election results raised hopes for a deal to end the Iran conflict, while Hormuz flows are already near pre-war levels.
- Our call: Brent reached our first target near 115.52, then the five-wave rally ended. The second target was not reached.
- Wave view: a correction of the whole rally is underway, with targets at 92.40 and 86.10.
This is an update to our October 22 oil and Brent Elliott Wave analysis. Below we check that call against what happened, explain the crash, and set out the new levels. You can follow the live count on our Brent crude analysis page.
How our October 22 Brent count played out
On October 22, Brent traded near $112 and we counted it in wave 5 up of the rally from the August 5 low at 78.13. Our first target was 115.52 and the second was 126.59, with the count failing below 96.56. Our alternate view warned that wave 5 could run out of steam near 115.52 and pull back.
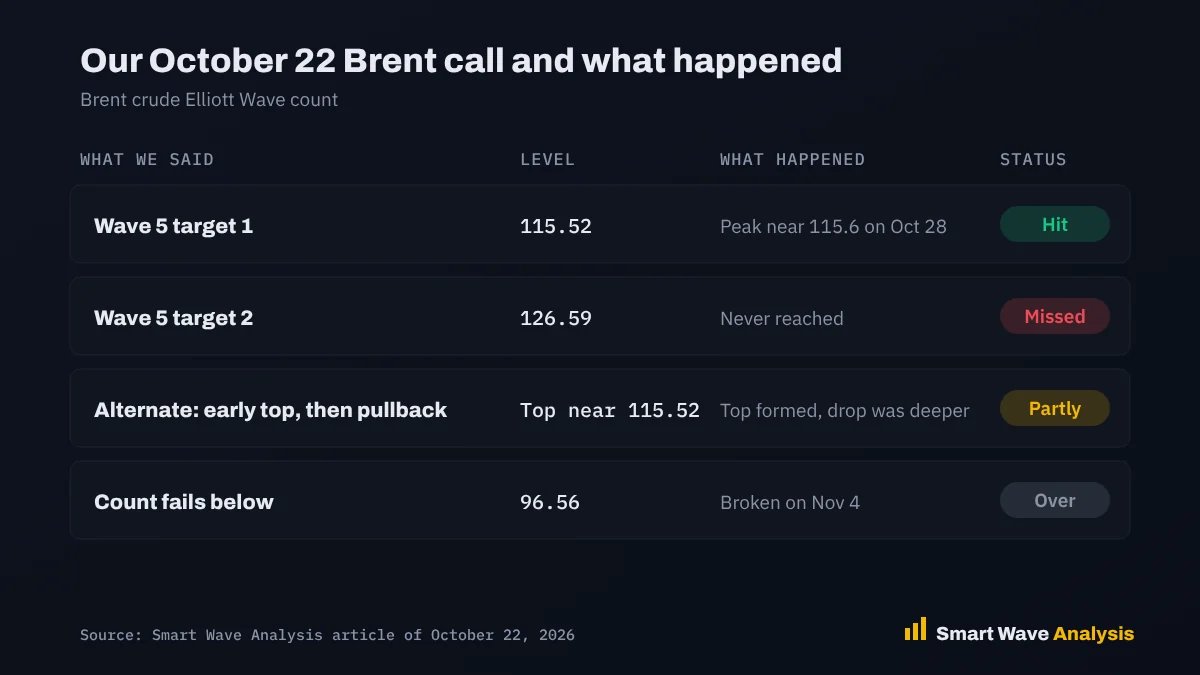
Brent peaked near 115.6 on October 28, right at our first target, and then reversed. The second target was never reached, and the drop below 96.56 on November 4 confirmed that the five-wave rally is complete. Our alternate view was right about the early top, but the decline has gone much deeper than the 104 to 105 pullback it expected. We show the misses as well as the hits, because readers need to know how a count performed.
Why oil crashed on November 4
Brent fell as low as $93.22 during the session. Republican losses in the US congressional elections raised expectations of a lower risk of further escalation in the war with Iran, according to Reuters. Ajay Parmar of ICIS said a deal now seems “more likely than not.” Claudio Galimberti of Rystad Energy said the administration faces greater pressure to find a Hormuz deal.
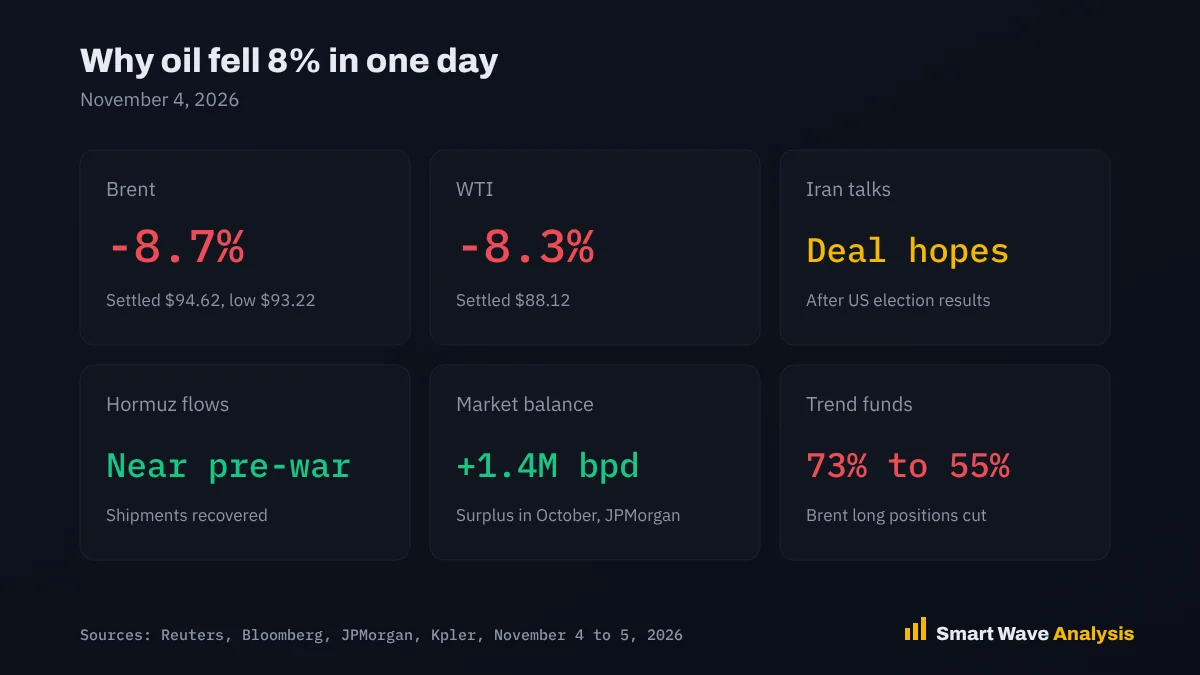
Supply is also looser than it was. Shipments through the Strait of Hormuz have recovered to near pre-war levels, and JPMorgan estimates the market moved into a surplus of 1.4 million barrels a day in October. Trend-following funds cut their Brent long positions to about 55% from 73%, which added to the selling. You can follow US stock levels in the EIA weekly petroleum report.
Not everyone expects prices to stay down. Mukesh Sahdev of XAnalysts noted that inventories in major consuming countries are near their lowest in 15 years, and that the new Congress does not take office until January. US diesel stocks also fell below 100 million barrels for the first time since 2003.
WTI on the intraday chart
WTI fell further in Asian trading on November 5, touching 86.66 twice before bouncing to about 88.08. That double low is the first support to watch, with resistance near the start of the session at 88.30 to 88.50.

Updated Brent Elliott Wave count
We now read the August to October advance as a completed five-wave rally from 78.13 to about 115.6. The fall since then is the first leg of a correction of that whole rally. Corrections after a five-wave move often retrace 50% to 78.6% of it.
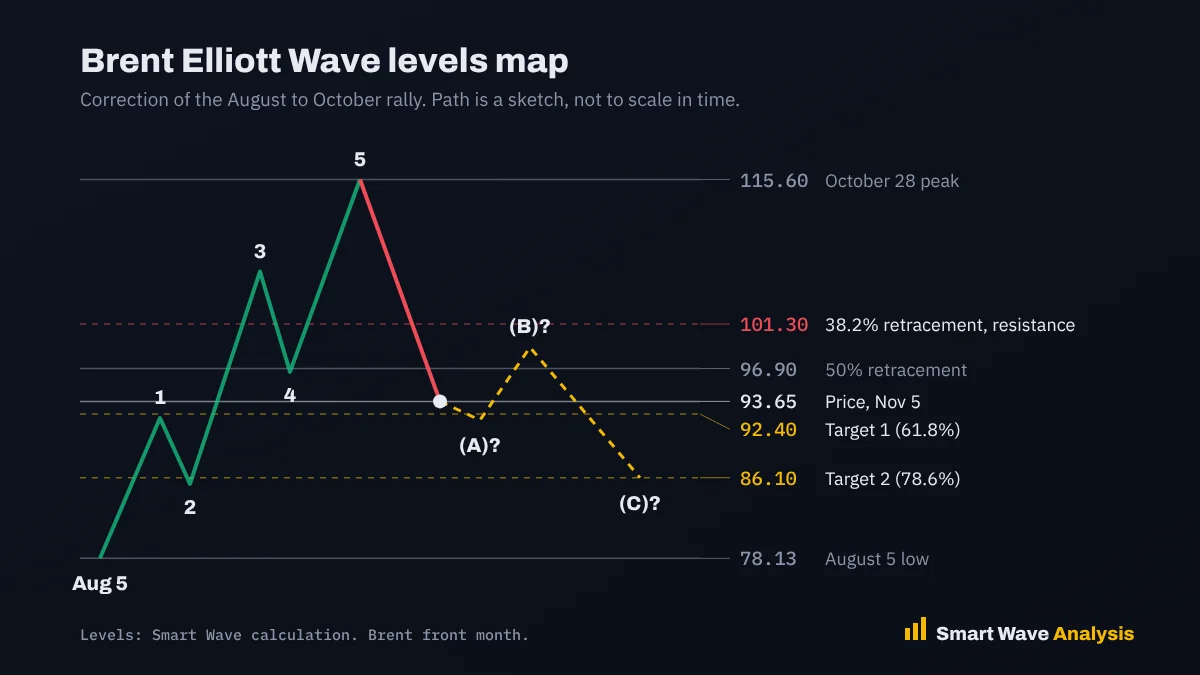
The 50% retracement at 96.90 has already broken. The next targets are the 61.8% retracement at 92.40, which price is close to now, and the 78.6% retracement at 86.10. A bounce, wave (B), could come first from the 92.40 area. You can check these levels with our Fibonacci calculator.
| Level | Brent | Why it matters |
|---|---|---|
| October peak | 115.6 | End of the five-wave rally |
| Resistance | 101.30 | 38.2% retracement. Above it, the correction may be over |
| 50% retracement | 96.90 | Broken on November 4 |
| Price | 93.65 | November 5, 2026 |
| Target 1 | 92.40 | 61.8% retracement |
| Target 2 | 86.10 | 78.6% retracement |
| August low | 78.13 | Start of the rally |
How we built this count
We kept the same daily structure from our October 22 article and updated it once the rally completed. Brent levels use the front-month contract, and the intraday chart uses WTI on TradingView. Targets use Fibonacci retracements of the rally from 78.13 to about 115.6. For the bigger supply picture, see the EIA Short-Term Energy Outlook.
Trade plan
- Bearish viewSell bounces toward 96.90 to 101.30 in Brent, with a stop above 101.30. Do not chase the move after an 8% drop.
- Targets92.40 first, then 86.10. Take profit at 92.40, where a bounce is likely.
- Headline riskAny news on Iran talks or Hormuz can move oil 5% or more in a day. Use smaller positions than usual.
- RiskSize each trade so a stop costs only 1% to 2% of your account. Our position size calculator does the math.
Want the next oil count before the move?
Get professional Elliott Wave analysis with updated charts, clear targets and invalidation levels for commodities, stocks, indices, forex and crypto.
- Daily chart updates
- Entry and stop levels
- Several timeframes
Frequently asked questions
Why did oil prices crash on November 4, 2026?
Brent fell 8.7% and WTI fell 8.3% after Republican losses in the US congressional elections raised hopes for a faster end to the Iran conflict. Hormuz shipments are already near pre-war levels, and JPMorgan estimates the market moved into a surplus of 1.4 million barrels a day in October.
Did the October 22 Brent count work?
Partly. Brent reached our first target of 115.52 with a peak near 115.6 on October 28, then reversed. The second target at 126.59 was not reached, and the drop below 96.56 confirmed that the five-wave rally is over.
What is the Brent Elliott Wave outlook now?
We read the fall from the October 28 peak as the start of a correction of the August to October rally. Targets are 92.40, the 61.8% retracement, and 86.10, the 78.6% retracement. A move back above 101.30 would weaken this view.
Will oil prices stay low?
Not certain. Commercial inventories in major consuming countries are near 15-year lows, and the new US Congress does not take office until January. Analysts expect more volatility.
Sources
- US Energy Information Administration: Weekly Petroleum Status Report
- US Energy Information Administration: Short-Term Energy Outlook
This analysis is for education and is not financial advice. Elliott Wave counts are probabilities, not certainties. Read our risk disclaimer.
Free Elliott Wave e-books
 FREE
Elliott Wave Forecasting Guide
A clear introduction to forecasting markets with the Elliott Wave Principle.
Get the free e-book FREE
Elliott Wave Trading Strategies
Practical setups for entries, stops and exits using wave structure.
Get the free e-book FREE
Beginner's Guide to Forex Trading
Forex basics for new traders: pairs, pips, lots, sessions and risk.
Get the free e-book FREE
Guide to Trading Stocks and ETFs
How stock and ETF markets work and how to read them with wave analysis.
Get the free e-bookFree download after a short sign-up with the publisher.
Educational content only. Nothing on this page is financial advice or a recommendation to buy or sell. Trading involves risk and you can lose money. Elliott Wave counts are probabilities, not certainties. Read our full disclaimer and affiliate disclosure.