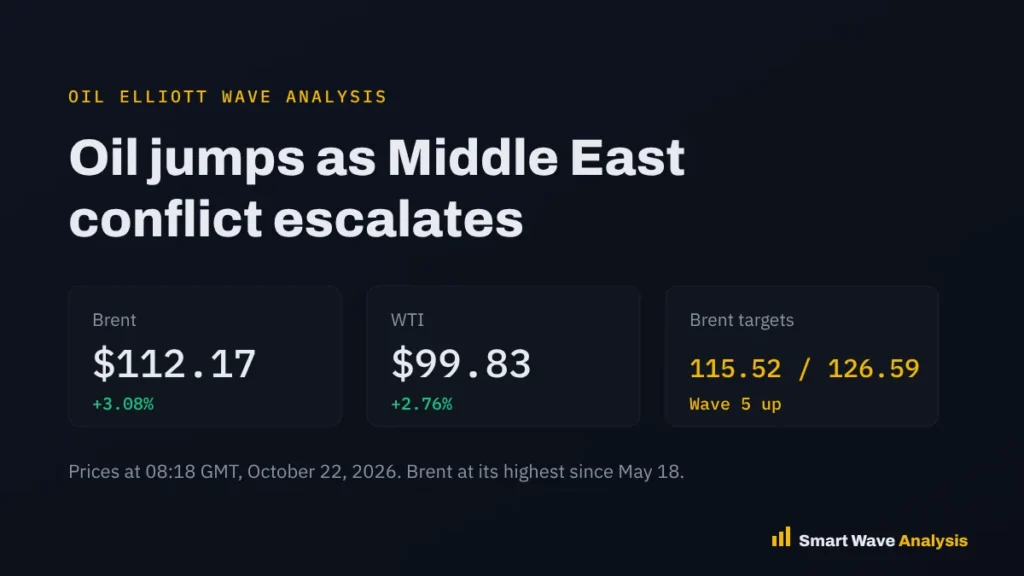
Oil jumped about 3% on October 22, 2026 after new attacks in Saudi Arabia and the Gulf. Brent rose to $112.17, its highest level since May 18, and WTI climbed to $99.83. On our daily chart, Brent is in wave 5 up of the rally that started at 78.13 on August 5. The targets are 115.52 and 126.59, and the count stays valid while price holds above 96.56. Count date: October 22, 2026.
Oil buyers stepped in again as the conflict in the Middle East spread to Saudi oil sites and shipping lanes in the Gulf. This post explains what moved prices, where oil stands after a wild year, and what the Brent crude Elliott Wave analysis says about the next move.
Why oil jumped on October 22, 2026
Brent rose $3.35, or 3.08%, to $112.17 a barrel by 08:18 GMT, after touching $112.55 earlier in the session, according to Reuters. WTI gained $2.68, or 2.76%, to $99.83. Several supply risks hit the market at once:
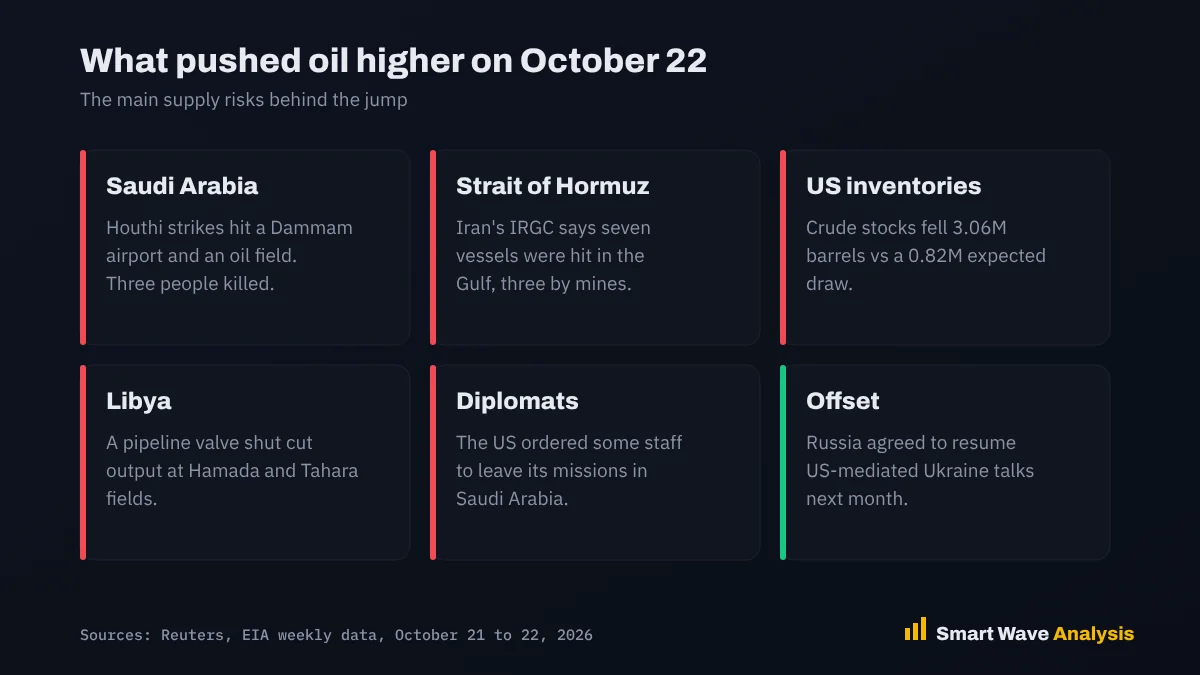
- Saudi Arabia: Yemen’s Houthis struck several targets on October 21. At least one person was killed at a civilian airport in Dammam, and two people died in a drone attack on a Saudi oil field.
- The Gulf and the Strait of Hormuz: Iran’s IRGC Navy said four vessels were hit and caught fire in the northern Gulf, and three more struck mines west of the Strait of Hormuz.
- US inventories: crude stocks fell 3.06 million barrels to 412.5 million, much more than the 820,000 barrel draw analysts expected, based on the EIA weekly petroleum report.
- Libya: a valve on a pipeline from the Hamada and Tahara oilfields was shut, which cut output at both fields.
- Diplomatic signals: the US State Department ordered some diplomats and their families to leave its missions in Saudi Arabia.
One factor pulled the other way. Russia agreed to resume US-mediated peace talks with Ukraine as soon as next month, which could ease some pressure on fuel supplies over time. Still, PVM Oil analyst Tamas Varga told Reuters that he expects no real de-escalation before the US midterm elections, which should keep oil prices high.
Where oil stands after a wild 2026
Oil has gone through a full cycle this year. Brent traded near $72 before the war with Iran began in early March, then spiked to a four-year high near $126 at the end of April. When tankers started moving through the Strait of Hormuz again, prices fell back to about $71.57 by July 1. Since then, oil has climbed steadily, and Brent posted a weekly gain of almost 5% in the week to October 16.
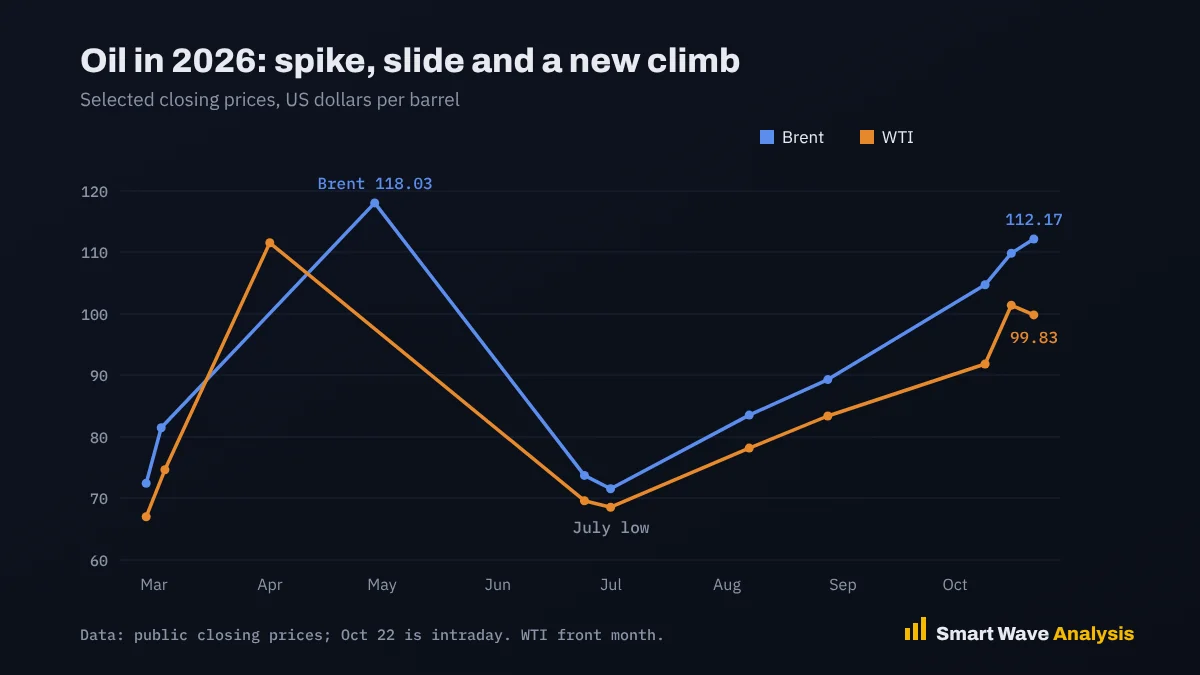
| Date (2026) | Brent | WTI | What happened |
|---|---|---|---|
| February 27 | 72.48 | 67.02 | Before the war |
| April 29 to 30 | 118.03 close, 126 high | 111.54 (Apr 1 close) | War peak, four-year high |
| July 1 | 71.57 | 68.58 | Lowest close after the spike |
| October 16 | 109.86 | 101.41 | Strong weekly gains |
| October 22 | 112.17 | 99.83 | Attacks in Saudi Arabia and the Gulf |
One note on WTI: the November contract expired on October 20, so most charts now show the December contract, which trades a few dollars lower. That roll explains part of the gap you may see on a continuous WTI chart this week.
Brent crude Elliott Wave count
Our daily count reads the rise from the August 5 low at 78.13 as a five-wave advance. Strong, broad rallies driven by real supply news fit the personality of an impulse wave.
- Waves 1 to 3: the climb from 78.13 into early October, with wave 3 the longest and fastest leg.
- Wave 4: the pullback that ended at 96.56. It stayed well above the August start of the rally, so the uptrend held.
- Wave 5: the rise from 96.56 that is now in progress. The push to a five-month high fits a fifth wave that makes a new high.
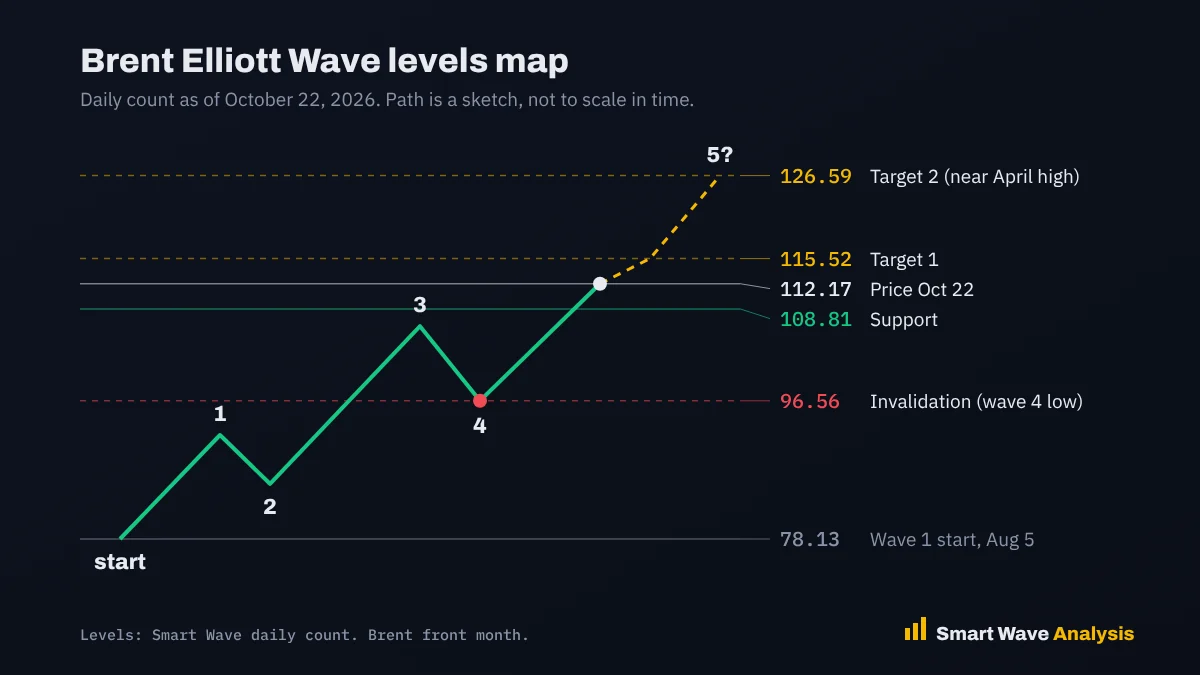
The first target at 115.52 is where wave 5 reaches a common Fibonacci ratio of the earlier waves. The second target at 126.59 sits right at the April high near $126, which makes it a strong magnet and a likely place for sellers to return. You can check these projections with our Elliott Wave target calculator and Fibonacci calculator.
| Level | Price | Why it matters |
|---|---|---|
| Target 2 | 126.59 | Near the April high. A likely end zone for wave 5 |
| Target 1 | 115.52 | First Fibonacci target for wave 5 |
| Price | 112.17 | October 22, 2026, intraday |
| Support | 108.81 | Prior resistance, now the first support |
| Invalidation | 96.56 | Wave 4 low. A daily close below it breaks the count |
What to watch in WTI
WTI is just below the round $100 level, which acted as both support and resistance this year. A daily close above $100 in the December contract would line WTI up with Brent’s breakout. The April peak close at 111.54 is the next big level above. If Brent pulls back from its targets, WTI will likely lose $100 again, so the two should be read together.
What this means for energy stocks
Higher oil prices usually lift oil producers and the energy sector. For the stock side of this move, see our XLE energy ETF analysis. Our earlier post on Strait of Hormuz risks and oil supply explains why shipping in the Gulf matters so much for prices.
Trade plan
- Bullish viewBuy dips toward 108.81 while Brent holds above it, with a stop below 104. The wider stop for a swing trade sits below 96.56.
- Targets115.52, then 126.59. Take some profit near 115.52, since fifth waves end the trend.
- Late buyersDo not chase. News spikes can reverse fast, and a single calm headline can wipe out a day’s gain.
- RiskSize each trade so a stop costs only 1% to 2% of your account. Our position size calculator does the math.
Want the next oil count before the move?
Get professional Elliott Wave forecasts with updated charts, clear targets and invalidation levels for oil, gold, stocks, forex and crypto.
- Daily chart updates
- Entry and stop levels
- Several timeframes
Frequently asked questions
Why did oil prices jump on October 22, 2026?
Houthi attacks in Saudi Arabia, reports of vessels hit near the Strait of Hormuz, a larger than expected drop in US crude stocks and a pipeline shutdown in Libya all raised fears about supply.
What is the Brent crude Elliott Wave target?
Our daily count puts Brent in wave 5 up, with targets at 115.52 and 126.59. The second target sits near the April 2026 high.
What would break the bullish Brent count?
A daily close below 96.56, the wave 4 low, would break it. A close below 108.81 would be the first warning.
Why is WTI cheaper than Brent?
WTI is priced in the United States, where supply is closer to home, while Brent reflects global seaborne oil that is more exposed to shipping risks in the Middle East. That gap tends to widen when Gulf shipping is under threat.
This analysis is for education and is not financial advice. Elliott Wave counts are probabilities, not certainties. Read our risk disclaimer.
Free Elliott Wave e-books
 FREE
Elliott Wave Forecasting Guide
A clear introduction to forecasting markets with the Elliott Wave Principle.
Get the free e-book FREE
Elliott Wave Trading Strategies
Practical setups for entries, stops and exits using wave structure.
Get the free e-book FREE
Beginner's Guide to Forex Trading
Forex basics for new traders: pairs, pips, lots, sessions and risk.
Get the free e-book FREE
Guide to Trading Stocks and ETFs
How stock and ETF markets work and how to read them with wave analysis.
Get the free e-bookFree download after a short sign-up with the publisher.
Educational content only. Nothing on this page is financial advice or a recommendation to buy or sell. Trading involves risk and you can lose money. Elliott Wave counts are probabilities, not certainties. Read our full disclaimer and affiliate disclosure.