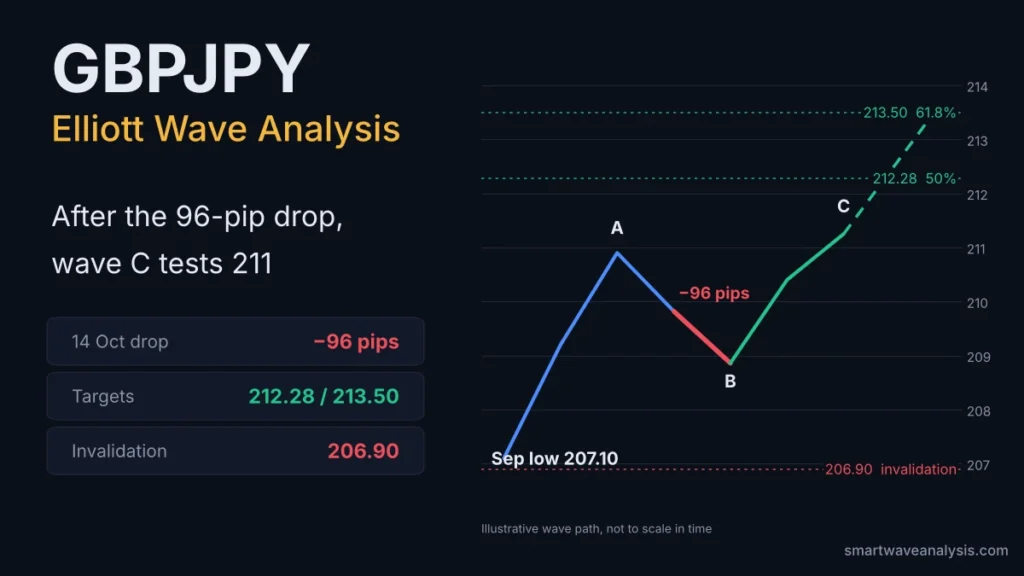
GBPJPY is rallying again. On 14 October 2026, the pair fell 96 pips from 209.82 to 208.86. Since then it has climbed to a high of 211.25 on 20 October. Our GBPJPY Elliott Wave count reads this as wave C up from the September low at 207.10. While price holds 206.90, the next targets are 212.28 and 213.50.
GBPJPY Key Levels at a Glance
Every level below comes from daily OANDA price data or a Fibonacci retracement built from it.
| Level | Wave meaning | What it signals |
|---|---|---|
| 217.46 | Late August high | Full recovery level |
| 213.50 | 61.8% retracement of 217.46 to 207.10 | Main wave C target |
| 212.28 | 50% retracement | First target above resistance |
| 211.06 – 211.25 | 38.2% retracement and the 20 Oct high | Resistance being tested now |
| 209.82 | Start of the 14 Oct drop | Former resistance, now first support |
| 208.86 | End of the 14 Oct drop | Key support for the rally |
| 207.10 | September low, start of wave C | Major support |
| 206.90 | Count invalidation | A daily close below ends the bullish count |
The Big Picture: GBPJPY Daily Elliott Wave Structure
GBPJPY has been correcting since its 15 July 2026 high at 219.52. Price action since then shows three large swings followed by a sideways range.
| Swing | Approximate dates | Price | Move |
|---|---|---|---|
| High | 15 Jul | 219.52 | Top of the year so far |
| Decline | Late Jul to early Aug | Near 210 | About 950 pips down |
| Rally | Aug | 217.46 | About 740 pips up |
| Decline | Late Aug to Sep | 207.10 | 1,036 pips down |
| Range | Mid Sep to mid Oct | 207.10 – 211 | Sideways base |
The last decline, at 1,036 pips, was close in size to the first one. Two roughly equal legs down are typical of a completed correction, and they match the equal legs behaviour of a zigzag. Our daily automatic wave scan treats the decline from 219.52 as complete, with price now in wave C of a recovery.
The 14 October Drop: 96 Pips in One Session
On 14 October, GBPJPY sold off from 209.82 to 208.86 within the same day, a fall of 0.96 yen, or 96 pips.
| Detail | Value |
|---|---|
| Start of move | 209.82 |
| End of move | 208.86 |
| Distance | 96 pips (0.96 yen) |
| Example stop for a short | 210.30 (48 pips above entry) |
| Reward to risk | 2 to 1 (2R) |
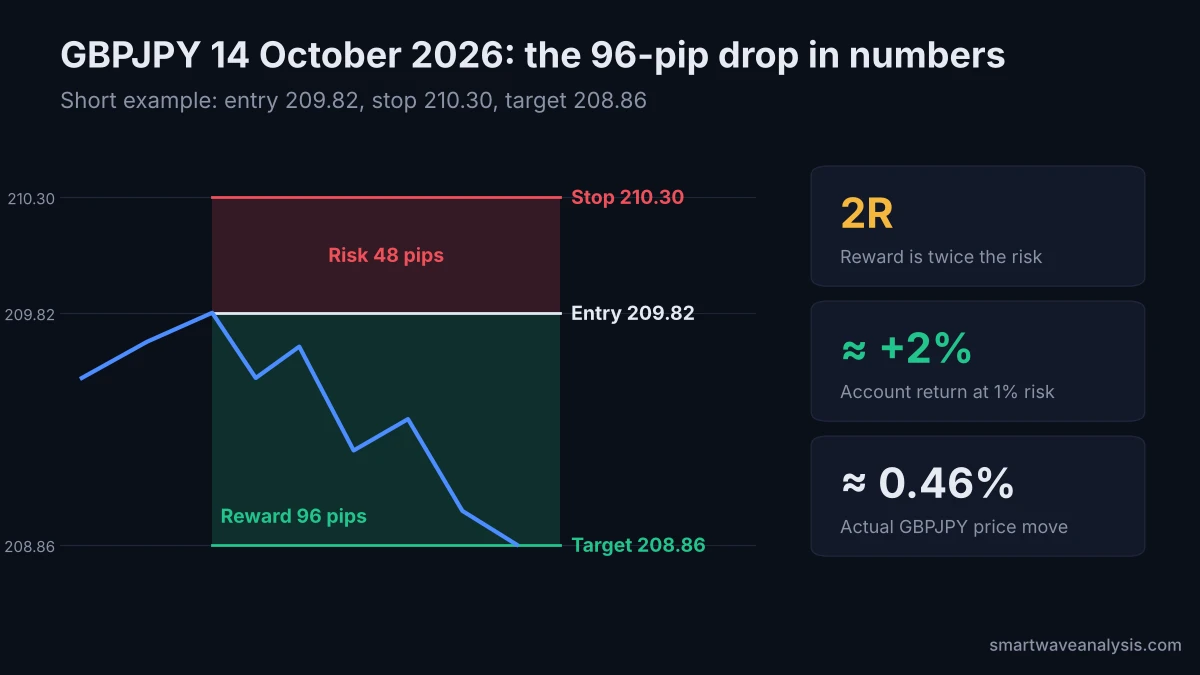
For traders who sold near 209.82 with a 48-pip stop, the target equalled two times the risk. Risking 1% of an account on that setup would have returned about 2%.
In wave terms, the drop fits as wave B inside the larger rally from 207.10. Wave B pullbacks often end near the 50% to 61.8% retracement of wave A, then give way to wave C.
Where GBPJPY Is Now: Wave C Testing the 38.2% Retracement
From the 208.86 area, GBPJPY rallied back to the top of its September to October range. On 20 October it traded between 210.79 and 211.25.
The Fibonacci retracements of the last big decline, 217.46 to 207.10, give the map for wave C:
| Retracement | Price | Status |
|---|---|---|
| 38.2% | 211.06 | Being tested (20 Oct high 211.25) |
| 50% | 212.28 | First target |
| 61.8% | 213.50 | Main target |
| 78.6% | 215.24 | Stretch target |

Corrective C waves often end between the 50% and 61.8% levels, which is why 212.28 to 213.50 is the main target zone. You can check these levels with our Fibonacci calculator.
Bullish, Bearish and Alternate Scenarios
Wave C up toward 212.28 to 213.50.
The range from 207.10 is still building a sideways wave B or triangle, so price may swing between 208.86 and 211.25 before any breakout.
| If GBPJPY | Then |
|---|---|
| Closes a day above 211.25 | Wave C is extending; targets 212.28, then 213.50 |
| Fails at 211.06 to 211.25 and drops below 209.82 | Wave B may be running deeper; watch 208.86 |
| Breaks below 208.86 | The rally loses momentum; 207.10 comes back into view |
| Closes a day below 206.90 | The bullish wave C count is invalid; the larger decline may resume |
What Moves GBPJPY: BoE vs BoJ
GBPJPY follows the gap between UK and Japanese interest rates, so central bank meetings can speed up or break a wave count.
| Central bank | Policy rate | Latest decision we confirmed | What to watch |
|---|---|---|---|
| Bank of England | 3.75% | Held on 18 June 2026, vote 7-2, with two members voting for a hike | Any shift toward hikes supports the pound |
| Bank of Japan | 1.00% | Held in late July 2026, vote 8-1; analysts expected the next hike in October | A hike at the late-October meeting would support the yen |
A BoJ hike in late October is the main risk to the bullish wave C count. A strong yen rally on that day could push GBPJPY back toward 208.86. Track meeting dates on our economic calendar.
How to Trade the GBPJPY Setup
This is an example plan for educational use, not a recommendation.
From a 210.00 entry, risk is 130 pips. Reward to target 1 is 228 pips, about 1.75 to 1, and to target 2 is 350 pips, about 2.7 to 1. GBPJPY moves fast, so size the trade with our position size calculator and check pip value with the pip value calculator.
Mistakes to avoid
- Holding a full position through the BoJ decision
- Chasing price above 211.25 without a daily close to confirm
- Moving the stop lower after 208.86 breaks; that level is what the setup depends on
We grade every published call, hit or miss, on our track record page.
Elliott Wave Terms Used in This Analysis
- Wave C: the final leg of a three-wave A-B-C correction. It often travels as far as wave A.
- Wave B: the counter move between A and C. It frequently retraces 50% to 61.8% of wave A.
- Equal legs: when wave C is about the same length as wave A, a common place for corrections to end.
- Fibonacci retracement: the share of a prior move that price gives back, most often 38.2%, 50% or 61.8%.
- Invalidation level: the price where a wave count is proven wrong.
- Pip: for yen pairs, 0.01. A move from 209.82 to 208.86 is 96 pips.
New to these terms? Start with the three Elliott Wave rules or our glossary.
GBPJPY Elliott Wave FAQs
Is GBPJPY going up or down?
The primary count is up. GBPJPY is in wave C of a recovery from the 207.10 September low, with targets at 212.28 and 213.50 while 206.90 holds.
What Elliott Wave is GBPJPY in right now?
Wave C up from 207.10. The 14 October drop from 209.82 to 208.86 fits as wave B, and price is now testing the 38.2% retracement at 211.06.
How many pips did GBPJPY fall on 14 October 2026?
96 pips, from 209.82 to 208.86. With a 48-pip stop, that equalled a 2 to 1 reward to risk.
What is the GBPJPY target?
212.28 is the first target and 213.50 the main target. 215.24 is a stretch target if wave C extends.
What level invalidates the bullish GBPJPY count?
A daily close below 206.90. A break below 208.86 would be the first warning.
Can the Bank of Japan change the GBPJPY outlook?
Yes. A BoJ rate hike can strengthen the yen quickly and push GBPJPY lower, so reduce position size around the meeting.
Related Markets and Analysis
- GBP/JPY live chart and wave count
- USD/JPY Elliott Wave
- GBP/USD Elliott Wave
- EUR/JPY Elliott Wave
- GBPCAD: 1.8749 low holds at equal legs
Educational content only. Nothing on this page is financial advice. Trading involves risk and you can lose money. Elliott Wave counts are probabilities, not certainties.
Free Elliott Wave e-books
 FREE
Elliott Wave Forecasting Guide
A clear introduction to forecasting markets with the Elliott Wave Principle.
Get the free e-book FREE
Elliott Wave Trading Strategies
Practical setups for entries, stops and exits using wave structure.
Get the free e-book FREE
Beginner's Guide to Forex Trading
Forex basics for new traders: pairs, pips, lots, sessions and risk.
Get the free e-book FREE
Guide to Trading Stocks and ETFs
How stock and ETF markets work and how to read them with wave analysis.
Get the free e-bookFree download after a short sign-up with the publisher.
Educational content only. Nothing on this page is financial advice or a recommendation to buy or sell. Trading involves risk and you can lose money. Elliott Wave counts are probabilities, not certainties. Read our full disclaimer and affiliate disclosure.