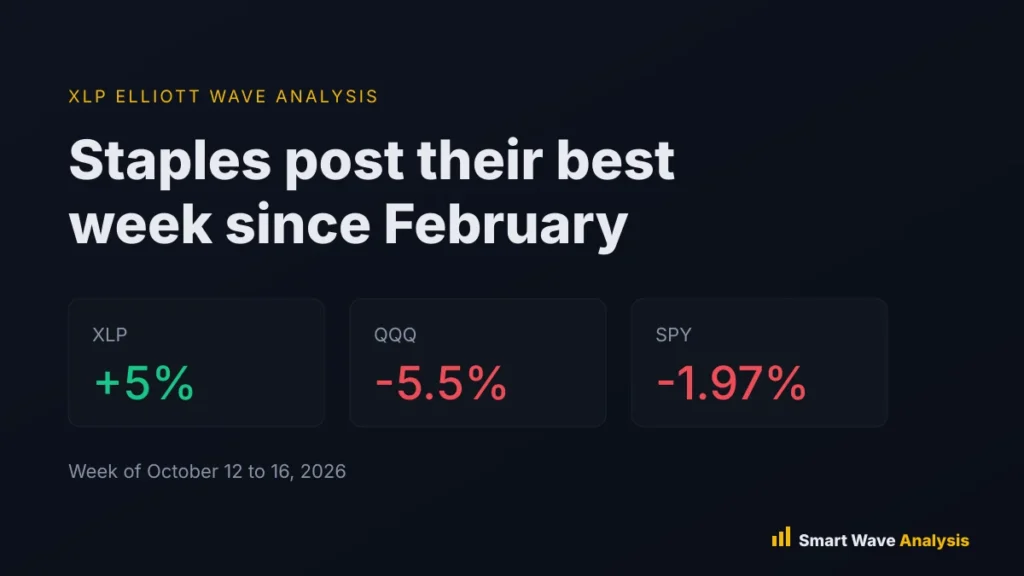
Quick answer: The Consumer Staples Select Sector SPDR Fund (XLP) gained 5% in the week of October 12 to 16, 2026, its best week since February, while the Nasdaq 100 fund QQQ fell 5.5%. On our daily chart, XLP is in wave 5 up, the last leg of its advance. The next targets are 89.39 and 90.49, and the count stays valid while price holds above 80.10. XLP closed at 87.62 on October 16. Count date: October 19, 2026.
Money moved out of technology and into defensive stocks last week. This post looks at what happened, why it matters for the XLP Elliott Wave analysis, and which levels decide the next move.
What happened in the week of October 12 to 16, 2026
Tech-led selling pulled the broad market lower. According to Stocktwits weekly market data, the main funds moved as follows:
| Fund | What it tracks | Weekly change | Note |
|---|---|---|---|
| XLP | S&P 500 consumer staples | +5% | Best week since February |
| XLY | S&P 500 consumer discretionary | -0.35% | Held up better than tech |
| SPY | S&P 500 | -1.97% | Worst week since June |
| QQQ | Nasdaq 100 | -5.5% | Steepest weekly loss in more than a year |

Bar chart of weekly changes: XLP up 5%, XLY down 0.35%, SPY down 1.97% and QQQ down 5.5% for October 12 to 16, 2026 Consumer staples (XLP) rose 5% while the Nasdaq 100 fund (QQQ) fell 5.5% in the same week.
A 10.5 point gap between XLP and QQQ in a single week is a large rotation. Investors sold growth stocks and bought companies that sell food, drinks and household goods, which people keep buying in any economy.
Three consumer stocks that led the move

Bar chart of weekly gains: Cracker Barrel up 20%, Signet Jewelers up 12.6% and VF Corp up 12% for October 12 to 16, 2026 Cracker Barrel, Signet and VF Corp led consumer stocks on company news.
Cracker Barrel (CBRL): up 20%
Cracker Barrel added 20% for the week, taking its gain this year to 171%. The company reported fiscal fourth quarter adjusted earnings of $0.99 per share against an estimate of $0.18, on revenue of $849.3 million. It also announced a $77 million sale-leaseback and the sale of Maple Street Biscuit Company. A new chief executive, David Deno, took over after Julie Felss Masino stepped down in August, and the company reversed its logo rebrand.
Signet Jewelers (SIG): up 12.6%
Signet rose 12.6% after Bloomberg reported that Signet and Richemont were in advanced talks to join a group buying De Beers, the diamond company. Their likely stakes were described as minor, so the move reflects hope more than a confirmed deal.
VF Corp (VFC): up 12%
VF Corp, the owner of brands such as The North Face and Vans, gained 12% after analyst upgrades. Truist moved the stock to Buy from Hold and raised its price target to $20 from $14. Piper Sandler also upgraded it, and Barclays lifted its target to $24 from $23. The company reports fiscal second quarter results on October 28.
Note that Cracker Barrel, Signet and VF Corp are consumer discretionary companies, not staples. Their gains came from company news. The steady buying in staples came from the sector rotation itself.
XLP Elliott Wave count
Rotation weeks like this can push a sector into the final part of its trend. On the XLP daily chart, our primary count is wave 5 up. Wave 4 ended at the 80.10 low, and the rally from there has carried XLP to 87.62, a gain of about 9.4%. Last week’s 5% jump took price close to the 52-week high of 90.14. Fifth waves often move fast at first and then lose strength near the top, so this is a late stage of the advance, not an early one. Read more about how each wave behaves in our wave personality lesson.
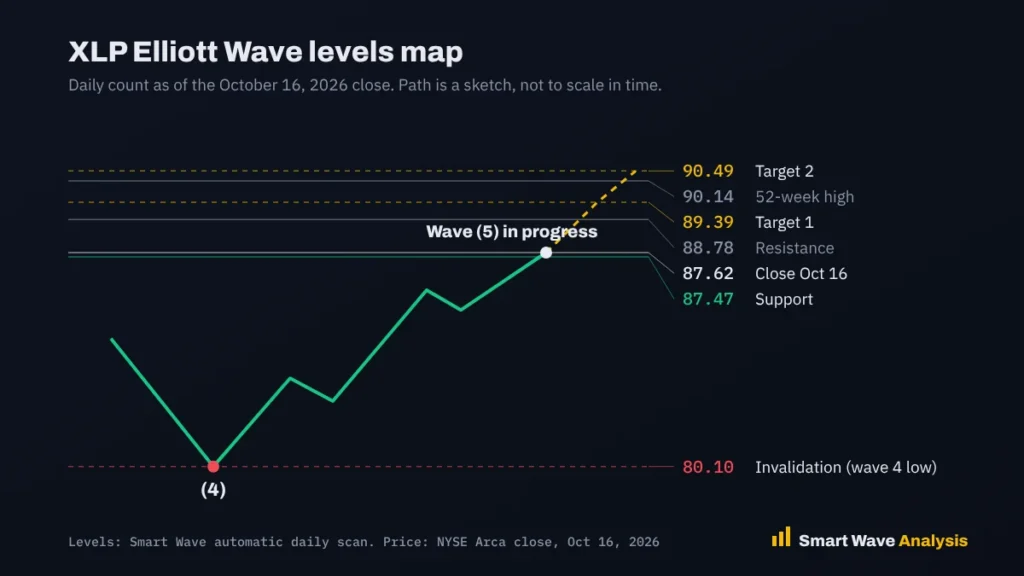
XLP Elliott Wave levels map: wave 4 low at 80.10, close at 87.62, targets 89.39 and 90.49, 52-week high 90.14 XLP is in wave 5 up from the 80.10 low. A move below 80.10 would break the count.
Alternate count: the rally is a three-wave bounce (A, B, C) inside a wide range below the 90.14 high, not a fifth wave. A daily close below 83.40, where last week’s rally began, would favor this view and point to a deeper pullback.
| Level | Price | Why it matters |
|---|---|---|
| Target 2 | 90.49 | Second Fibonacci target for wave 5, just above the 52-week high |
| 52-week high | 90.14 | Sellers showed up here before |
| Target 1 | 89.39 | First Fibonacci target for wave 5 |
| Resistance | 88.78 | Nearest swing high above price |
| Last close | 87.62 | October 16, 2026 |
| Support | 87.47 | Nearest swing low below price |
| Invalidation | 80.10 | Wave 4 low. A break means the count is wrong |
You can check these targets yourself with our Elliott Wave target calculator and Fibonacci retracement calculator.
How our view compares with other public counts
Some public counts treat last week’s rally in staples as a short bounce inside a larger sideways range. We see more than a bounce, because the move came with a sharp drop in tech, which points to real money moving between sectors rather than a one-week reaction. Still, our count also says the trend is late. If XLP pushes above 89.39 and then stalls, that fits a fifth wave ending. A five-wave decline below 87.47 and then 83.40 would favor the range view.
What the rotation means for SPY and QQQ
Staples tend to lead when investors expect slower growth. When XLP rises while QQQ falls hard, the broad market is often in a corrective phase. For the bigger picture, see our S&P 500 Elliott Wave analysis and our earlier post on the SPY wave 3 setup. A useful check is the XLY to XLP ratio: while it keeps falling, investors are still choosing safety over risk.
Trade plan
- Bullish view: wave 5 has room toward 89.39 and 90.49, but the upside is small next to the distance to the 80.10 invalidation. New buyers need a closer stop, such as a daily close below 87.47 or 83.40, and a smaller position.
- Targets: 89.39, then 90.49. Taking some profit near the 90.14 high is sensible, since fifth waves end the trend.
- Holders: traders already long from lower levels can raise their stops as price nears the targets.
- Risk: size the trade so a stop out costs only 1% to 2% of your account. Our position size calculator does the math.
- Event risk: large staples companies report earnings in the coming weeks, and gaps around results can skip over levels.
Frequently asked questions
Why did consumer staples rise while the market fell?
Investors sold technology stocks and moved money into defensive sectors. Staples companies sell everyday products that people keep buying in slow economies, so their profits are seen as safer.
What is XLP?
XLP is the Consumer Staples Select Sector SPDR Fund. It holds the consumer staples companies in the S&P 500, such as large food, drink and household product makers and big retailers.
Are Cracker Barrel, Signet and VF Corp staples stocks?
No. All three are consumer discretionary companies. They rose on company news: earnings and a turnaround at Cracker Barrel, deal talk at Signet and analyst upgrades at VF Corp.
What would invalidate the XLP wave count?
A daily close below 80.10, the wave 4 low, would break our primary count. A close below 83.40 would be the first warning. We update the count on the XLP page when the structure changes.
Sources
- Stocktwits: Staples Defy Market Rout in Best Week Since February (October 19, 2026)
- Select Sector SPDR Trust: XLP fund page and holdings
- SEC EDGAR: Cracker Barrel filings
This analysis is for education and is not financial advice. Elliott Wave counts are probabilities, not certainties. Read our risk disclaimer.
Free Elliott Wave e-books
 FREE
Elliott Wave Forecasting Guide
A clear introduction to forecasting markets with the Elliott Wave Principle.
Get the free e-book FREE
Elliott Wave Trading Strategies
Practical setups for entries, stops and exits using wave structure.
Get the free e-book FREE
Beginner's Guide to Forex Trading
Forex basics for new traders: pairs, pips, lots, sessions and risk.
Get the free e-book FREE
Guide to Trading Stocks and ETFs
How stock and ETF markets work and how to read them with wave analysis.
Get the free e-bookFree download after a short sign-up with the publisher.
Educational content only. Nothing on this page is financial advice or a recommendation to buy or sell. Trading involves risk and you can lose money. Elliott Wave counts are probabilities, not certainties. Read our full disclaimer and affiliate disclosure.