
Summary: XLE completed a five-wave advance from its July 1, 2026 low near $53 to a $66.41 high. It then corrected in a three-wave zigzag that bottomed near $60.95. The preferred count labels that low as Wave (2). A daily close above $66.41 would confirm Wave (3). A break below $60.95 would favor the alternate count.
XLE Elliott Wave Outlook at a Glance
| Item | Level or Status |
|---|---|
| Instrument | State Street Energy Select Sector SPDR ETF (XLE) |
| Prior advance | Five waves, $53.22 (July 1 close) to $66.41 |
| Correction | Zigzag (5-3-5), low near $60.95 |
| Retracement depth | About 41% of the advance |
| Preferred count | Early Wave (3) |
| Confirmation trigger | Daily close above $66.41 |
| First target zone | $67.72 to $69.81 |
| Invalidation | Below $60.95 (preferred count); below $53.22 (bullish structure) |
| Timeframes | Daily for structure, 4-hour for execution |
What Is a Zigzag Correction in Elliott Wave?
A zigzag is a three-wave correction labelled A-B-C. It moves sharply against the trend of one larger degree. Its internal structure is 5-3-5:
- Wave A unfolds in five waves.
- Wave B unfolds in three waves.
- Wave C unfolds in five waves.
Of all the corrective patterns, the zigzag gives back the most ground in the least time.
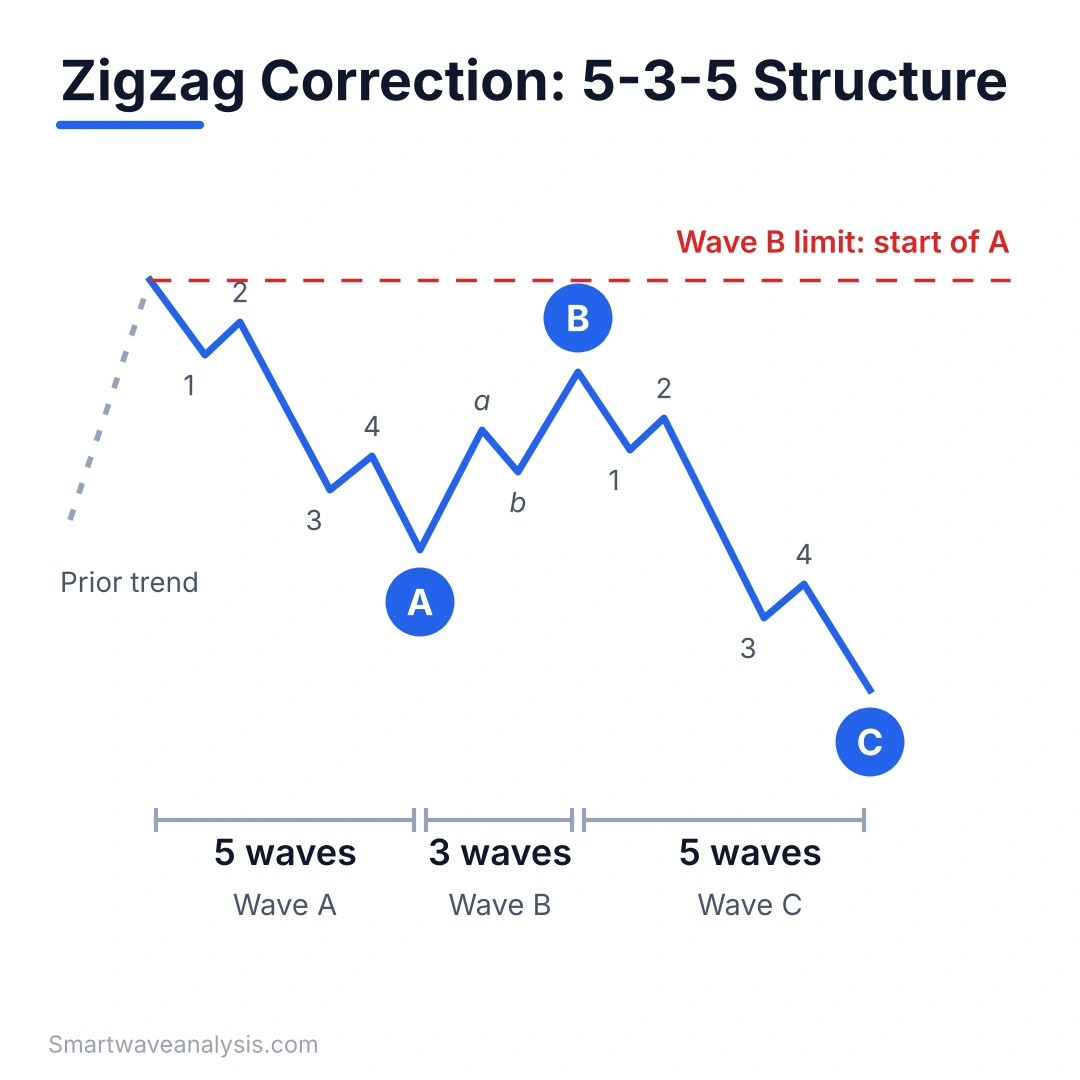
The 5-3-5 Structure of Waves A, B and C
- Wave A is an impulse or a leading diagonal. It is the first move against the trend.
- Wave B can be any corrective pattern: a zigzag, flat, triangle or combination.
- Wave C is an impulse or an ending diagonal. It usually carries price past the end of Wave A.
Zigzag Rules vs. Guidelines (Sourced from Frost & Prechter)
Competing articles quote different Wave C ratios (100% to 123.6%, 100% to 161.8%, and even 261.8%). The confusion comes from mixing hard rules with typical tendencies. Elliott Wave Principle by A.J. Frost and Robert Prechter keeps them separate:
| Statement | Type |
|---|---|
| Wave B never moves beyond the start of wave A. | Rule |
| Wave B is a corrective pattern (zigzag, flat, triangle or combination) | Rule |
| Wave C almost always ends beyond the end of wave A. | Guideline |
| Wave B typically retraces 38 to 79 per cent of wave A | Guideline |
| If wave B is a zigzag, it will typically retrace 50 to 79 per cent of wave A. | Guideline |
| If wave A is a leading diagonal, an ending diagonal is not expected for wave C | Guideline |
| In a standard zigzag, Wave C frequently equals Wave A in length; 61.8% and 161.8% are the next most common ratios | Guideline ●●● 𝙎𝙞𝙣𝙜𝙡𝙚 𝙕𝙞𝙜𝙯𝙖𝙜 (SZ or ZZ) +5 |
Only a broken rule invalidates a zigzag. A missed guideline only lowers confidence in the count.
Where Zigzags Usually Appear
Simple zigzags show up in Wave 2, in Wave 4 (unless Wave 2 already took that form), in the W and Y legs of a double zigzag, as Wave B of a larger zigzag, and as Wave X of a double zigzag. In a double zigzag, each wave X is a reactionary wave and thus always a corrective wave, typically another zigzag.
🚀 Don’t Miss the Next Move
Get daily Elliott Wave counts, live chart updates, and high-probability trade setups across crypto, forex, and stocks — before the market moves.
👉 Start Your 14-Day Trial for Just $0.99 →Cancel anytime. No long-term commitment. (Affiliate link — we may earn a commission at no extra cost to you.)
What Is XLE and What Drives Its Price?
XLE seeks to track the Energy Select Sector Index, which represents the energy sector of the S&P 500 Index. Key fund facts:
- It launched on December 16, 1998.
- It carries a 0.08% gross expense ratio.
- As of October 12, 2026, it held 21 stocks with about $42.98 billion in assets.
Split note for chart readers: State Street split XLE 2-for-1, effective December 5, 2025. The split took the estimated share price from $91.06 to $45.53. Any wave count spanning that date must use split-adjusted data. Otherwise, late 2025 shows a false 50% collapse.
XLE Holdings: Why Exxon Mobil and Chevron Matter for the Wave Count
As of October 12, 2026, Exxon Mobil made up 23.71% of the fund, Chevron 17.73%, and ConocoPhillips 6.90%. Oil, gas and consumable fuels companies account for 92.26% of the portfolio.
With about 41% of the fund in two stocks, a wave count on XLE is largely a count on XOM and CVX. If both stocks show the same corrective structure ending, the XLE count gains weight.
Crude Oil and the October 2026 EIA Outlook
According to the EIA’s October 2026 Short-Term Energy Outlook:
- A pipeline disruption pushed the daily Brent spot price as high as $131 per barrel on September 15.
- The agency now expects Brent to average $105 per barrel in the fourth quarter of 2026, $14 above its prior forecast, and to fall to about $84 in 2027.
- It also warned that conflict in the Middle East will likely keep short-term crude prices more volatile than its forecast shows.
Against that backdrop, XLE’s NAV returned 40.13% year-to-date through September 30, 2026. Elliott Wave practice does not trade headlines. However, supply shocks can stretch or shorten a wave, which is why the invalidation levels below matter.
XLE Daily Chart: The Larger Wave Count
The Five-Wave Impulse Before the Correction
Elliott Wave Forecast labels the advance from the July 1 low as an impulse of waves 1 through 5 that peaked at $66.41. XLE closed at $53.22 on July 1, 2026. Using that close, the advance gained $13.19, or about 24.8%. Its final leg overlapped with the September oil spike.
Wave Degree and Labelling Used in This Analysis
This analysis labels the July to September advance as Wave (1) at Intermediate degree, written in parentheses. Sub-waves use plain numerals and letters. This is a judgment call. If your weekly chart shows the July rally as the fifth wave of a larger advance, read the alternate count section first.
XLE 4-Hour Chart: How the Zigzag Correction Unfolded
Wave A: The Five-Wave Decline
The decline from $66.41 opened in five waves, faster than any pullback during the July rally. That speed is the first sign of a zigzag rather than a sideways flat.
Wave B: The Three-Wave Bounce
The bounce subdivided into three waves and stayed below $66.41, so the main zigzag rule held.
Wave C: Where the Correction Ended
Elliott Wave Forecast projected the correction into an equal-legs zone between $61.81 and $59.98. Trade Ideas data shows XLE’s one-month low at $60.95 as of October 8, inside that zone. The past-week low was $61.04, which places the bottom between September 21 and October 1. Over the past month as of October 8, XLE ranged from $60.95 to $66.17, and over the past week from $61.04 to $64.06.
Measured Fibonacci Ratios in This XLE Zigzag
| Measurement | Value |
|---|---|
| Wave (1) advance | $53.22 to $66.41 = $13.19 |
| Wave (2) zigzag | $66.41 to $60.95 = $5.46 |
| Retracement of Wave (1) | 41.4% |
| 38.2% / 50% / 61.8% retracement levels | $61.37 / $59.82 / $58.26 |
| Low relative to the 38.2% level | $0.42 below it |
These figures use the July 1 close as the starting point. Intraday lows and different data feeds vary by a few cents, so redraw the levels on your own chart.
What the measurement tells you: second waves often retrace 50% to 61.8% of the first wave. A 41% pullback is shallow for a Wave (2). Shallow second waves often come before strong third waves. They can also mean the label is wrong, which is why the alternate count stays on the table.
How to Confirm Wave C Has Ended
The Channelling Technique
Use the channel to estimate where Wave C will end:
- Draw a line from the start of Wave A ($66.41) to the end of Wave B.
- Draw a parallel line through the end of Wave A.
Wave C often ends upon reaching a line drawn from the end of Wave A that is parallel to a line connecting the start of Wave A and the end of Wave B.
RSI Divergence, MACD and Volume Clues
On the 4-hour chart, look for these signs at the Wave C low:
- RSI makes a higher low while price makes a lower low.
- MACD histogram readings shrink.
- Selling volume fades.
The strongest confirmation is a five-wave rise off the low, because corrections move in threes and impulses move in fives.
Cross-Check With XOM, CVX and Crude Oil
Count XOM and CVX on the same timeframe. If both completed three-wave declines in late September and are now rising in fives, the XLE count gains support. If either is still falling impulsively, treat the XLE rally with caution.
XLE Price Targets and Invalidation Level

Bullish Scenario: Next Fibonacci Extension Targets
The targets below project the length of Wave (1) from the Wave (2) low at $60.95:
| Extension of Wave (1) | Target |
|---|---|
| 61.8% | $69.10 |
| 100% | $74.14 |
| 161.8% | $82.29 |
The 61.8% projection ($69.10) falls inside Elliott Wave Forecast’s $67.72 to $69.81 target zone. That overlap from two separate methods makes the zone stronger. The 161.8% level is the classic Wave 3 objective.
None of these targets applies until Wave (3) is confirmed. On October 12, XLE reached $66.42 intraday but closed at $66.01. That touched the $66.41 high without a close above it.
Alternate Count: Expanded Flat or Double Zigzag
- Expanded flat: the whole zigzag becomes Wave A of a flat, and the current push above $66.41 becomes Wave B. Wave C would then fall below $60.95.
- Double zigzag: if price fails below $66.41 and breaks $60.95, the correction extends as W-X-Y. The next support would be the 50% to 61.8% zone ($59.82 to $58.26).
The Price Level That Invalidates This Count
| Level | Meaning |
|---|---|
| Daily close above $66.41 | Wave (3) confirmed |
| Break below $60.95 | Preferred count invalid; alternate counts lead |
| Break below $53.22 | Entire bullish structure from July invalid |
Trade Plan for the XLE Zigzag Setup
Entry Zone and Stop-Loss Placement
Traders who missed the Wave C low have two choices:
- Wait for a daily close above $66.41.
- Buy a three-wave pullback that holds above $60.95.
Either way, the stop goes below $60.95, where the count fails.
Scaling Out and Trailing Stops
Take partial profits at $69.10 and $74.14. After each new high, trail the stop below the end of the most recent completed fourth wave.
Position Sizing for an ETF Trade
Risk a fixed share of your account on every trade. Example:
- Account size: $50,000. Risking 1% means a maximum loss of $500.
- Entry at $64.00 with a stop at $60.85 means $3.15 of risk per share.
- $500 ÷ $3.15 = 158 shares.
The stop sets the position size, not the other way around.
Zigzag vs. Flat vs. Triangle: How to Tell Them Apart
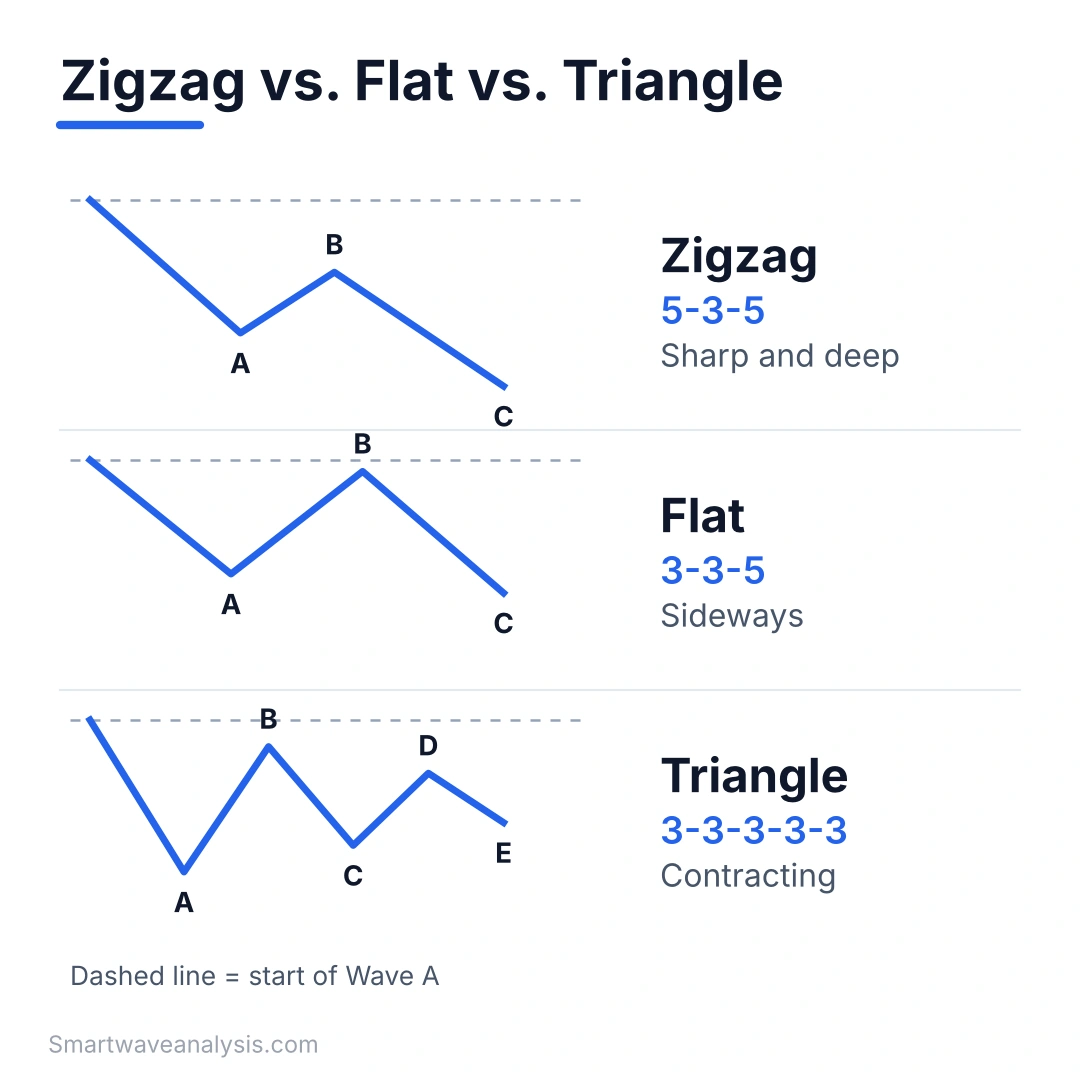
| Pattern | Structure | Wave B | Shape | Common Location |
|---|---|---|---|---|
| Zigzag | 5-3-5 | Stays inside the start of A; often 38 to 79% | Sharp | Wave 2, Wave B |
| Regular flat | 3-3-5 | Retraces at least 90 per cent of wave A | Sideways | Wave 4 |
| Expanded flat | 3-3-5 | More than 105% of A, with C beyond the end of A | Sideways, wide | Wave 4, Wave B |
| Running flat | 3-3-5 | More than 100% of A, with C short of the end of A | Upward sloping | Strong trends |
| Triangle | 3-3-3-3-3 | Each leg smaller (contracting) | Sideways | Wave 4, Wave B |
| Double zigzag | W-X-Y | X wave is corrective | Deep, steep | Wave 2, Wave B |
A flat correction usually retraces less of the preceding impulse wave than does a zigzag.
Common Mistakes When Counting Zigzag Corrections
- Calling any three-wave drop a zigzag without checking that Wave A has five waves.
- Using charts that are not split-adjusted across December 2025.
- Treating an intraday poke above a high as confirmation instead of waiting for a close.
- Counting the 4-hour chart without checking the daily and weekly structure.
- Ignoring XOM and CVX, which drive about 41% of XLE.
FAQS
What is a zigzag correction in Elliott Wave?
A zigzag is a sharp three-wave correction labelled A-B-C with a 5-3-5 internal structure. Waves A and C unfold in five waves, and Wave B unfolds in three. Wave B can never move past the start of Wave A. Zigzags most often form in the Wave 2 position.
Is the XLE correction over?
The preferred count says yes. The zigzag likely ended near $60.95 in late September, about 41% below the $66.41 high. Confirmation requires a daily close above $66.41. As of October 12, XLE touched $66.42 intraday but closed at $66.01.
What is the next price target for XLE?
If Wave (3) is confirmed, the first target zone is $67.72 to $69.81, with a 61.8% Fibonacci projection at $69.10. The higher projections are $74.14 (100%) and $82.29 (161.8%). These are projections, not predictions.
What invalidates the XLE zigzag count?
A break below $60.95 invalidates the preferred count. In that case, an expanded flat or double zigzag becomes the lead scenario. A break below the July start near $53.22 would invalidate the entire bullish structure from July.
How far does Wave C usually go in a zigzag?
Wave C most often equals Wave A in length. The next most common relationships are 61.8% and 161.8% of Wave A. These ratios are guidelines, not rules. Wave C almost always ends beyond the end of Wave A.
What is the difference between a zigzag and a flat?
A zigzag is 5-3-5 and sharp, and Wave B stays well inside the start of Wave A. A flat is 3-3-5 and sideways, with Wave B retracing at least 90% of Wave A. Flats usually retrace less of the prior trend than zigzags.
Free Elliott Wave e-books
 FREE
Elliott Wave Forecasting Guide
A clear introduction to forecasting markets with the Elliott Wave Principle.
Get the free e-book FREE
Elliott Wave Trading Strategies
Practical setups for entries, stops and exits using wave structure.
Get the free e-book FREE
Beginner's Guide to Forex Trading
Forex basics for new traders: pairs, pips, lots, sessions and risk.
Get the free e-book FREE
Guide to Trading Stocks and ETFs
How stock and ETF markets work and how to read them with wave analysis.
Get the free e-bookFree download after a short sign-up with the publisher.
Educational content only. Nothing on this page is financial advice or a recommendation to buy or sell. Trading involves risk and you can lose money. Elliott Wave counts are probabilities, not certainties. Read our full disclaimer and affiliate disclosure.