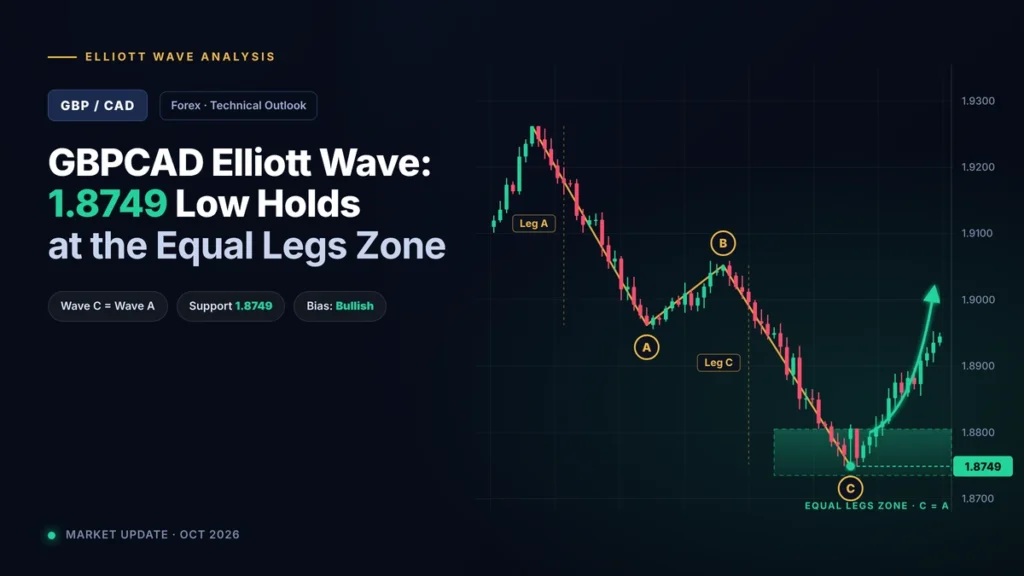
GBPCAD completed a three-wave pullback into the equal legs area at 1.8766 to 1.8685 this week, and buyers defended it. The pair printed a low at 1.8749 on the 1-hour chart and bounced back above 1.88 by October 15. While price holds above 1.8685, the bias stays bullish, and dips into support are buying opportunities, not shorting opportunities.
This analysis covers the wave structure, the exact math behind the equal legs zone, a trade plan with invalidation, and the central bank and oil factors that can push GBP/CAD either way before the end of October.
GBPCAD Key Levels at a Glance
| Level | Price | Role |
|---|---|---|
| Recent swing high | about 1.8885 | 30-day high; a break above it confirms the next leg up |
| Risk-free trigger | about 1.8817 | 50% retracement of the drop from 1.8885 to 1.8749 |
| Equal legs zone (100%) | 1.8766 | Top of the buyers’ area |
| Reaction low | 1.8749 | Where the correction ended |
| Equal legs zone (123.6%) | 1.8685 | Bottom of the buyers’ area |
| Invalidation | below 1.8685 | A sustained break weakens the bullish count |
The zone and reaction low come from the published 1-hour count. The 1.8885 level is the 30-day high per Eurochange as of October 15, 2026. Check live quotes before acting.
What Is the Equal Legs Area in Elliott Wave?
The equal legs area is the price zone where the second leg of a three-wave correction matches the first leg in length. Traders measure it from 100% to 123.6% of the first leg, projected from the end of the middle wave. Corrections often end there, so it marks where to look for trades in the direction of the larger trend.

ElliottWave-Forecast defines equal legs as swing A equaling swing C, with B as the correction. That matches classic guidance that wave C often equals wave A, as Dukascopy’s Elliott Wave guide notes.
Equal Legs vs. the AB=CD Pattern
The harmonic AB=CD pattern uses the same measurement. Elliott Wave traders add one condition: the structure must be corrective. The zone runs to 123.6% to allow a modest overshoot. A slice through it toward 161.8% signals a more complex correction.
How to Calculate an Equal Legs Zone
You need three swing points and a Fibonacci extension tool, which TradingView and MetaTrader both include. Round numbers keep this example simple; use the swings on your own chart.
- Measure wave W. Example: W falls from 1.9000 to 1.8800, a 200-pip leg.
- Find the end of wave X. Example: X bounces to 1.8900. All projections start here.
- Project 100% and 123.6%. 1.8900 minus 200 pips = 1.8700. 1.8900 minus 247 pips = 1.8653.
The zone is 1.8700 to 1.8653. On the extension tool, click the start of W, the end of W, then the end of X, and read the 1.0 and 1.236 lines. For upward corrections, add the leg instead of subtracting it.
GBPCAD Elliott Wave Structure on the 1-Hour Chart
The October pullback unfolded in three waves, labelled W, X and Y in red on the published 1-hour count. Three waves mean a correction against the trend. Five waves down would have signalled a new decline.
The W-X-Y Double Three
A double three joins two simple corrections with a connector wave X. On October 14, wave Y had not yet reached the equal legs area, so the plan was to avoid selling and wait for buyers at 1.8766 to 1.8685. Bracketed labels such as (A) or ((A)) mark larger degrees, the fractal structure Ralph Nelson Elliott described in The Wave Principle (1938).
How Buyers Reacted at 1.8749
Price printed its low at 1.8749, 17 pips inside the 100% level and 64 pips above the 123.6% level. Daily closes from MTFX show 1.8785 on October 14 and 1.8836 on October 15, about 85 pips off the low.
Higher-Timeframe Context: 4-Hour and Daily Charts
Over the 30 days to October 15, GBPCAD ranged from 1.8676 to 1.8885, per Eurochange. The 1-hour pullback is a small correction inside that daily range, so the realistic first objective is the range high, not a runaway rally. A daily close above 1.8885 would suggest the larger cycle is turning up.
The 3-7-11 Swing Sequence
Corrections tend to unfold in 3, 7 or 11 swings, and impulses in 5 or 9. A simple ABC has 3 swings, a double three (W-X-Y) has 7, and a triple three (W-X-Y-X-Z) has 11. A pullback that reaches the equal legs area on a 3 or 7 swing count is mature, which is what GBPCAD showed this week.
GBPCAD Trade Plan: Entry, Invalidation and Targets

Entry and Stop-Loss Placement
Buyers could enter at 1.8766 or scale in down to the zone midpoint near 1.8725. A stop at 1.8670 sits below the 123.6% level, outside normal noise. A close below 1.8685 says the correction is not behaving like a simple double three.
When the Trade Becomes Risk-Free
Move the stop to breakeven once the bounce retraces 50% of the final leg. From 1.8885 to 1.8749, that level is about 1.8817, which daily closes above 1.8830 on October 15 already cleared.
Upside Targets and Reward-to-Risk
| Entry | Stop | Target | Risk | Reward | Reward-to-risk |
|---|---|---|---|---|---|
| 1.8766 (zone top) | 1.8670 | 1.8885 | 96 pips | 119 pips | 1.2 to 1 |
| 1.8725 (zone midpoint) | 1.8670 | 1.8885 | 55 pips | 160 pips | 2.9 to 1 |
The first target is the 30-day high near 1.8885. Risk no more than 1% to 2% of account equity per trade, and size the position from the stop distance.
🚀 Don’t Miss the Next Move
Get daily Elliott Wave counts, live chart updates, and high-probability trade setups across crypto, forex, and stocks — before the market moves.
👉 Start Your 14-Day Trial for Just $0.99 →Cancel anytime. No long-term commitment. (Affiliate link — we may earn a commission at no extra cost to you.)
Bullish vs. Bearish Scenarios
| Scenario | What it means | Confirmation | Rejection |
|---|---|---|---|
| Primary (bullish) | The W-X-Y correction ended at 1.8749 and the uptrend resumes | Daily close above 1.8885 | Break below 1.8685 |
| Alternate (complex correction) | The pullback grows into a triple three (W-X-Y-X-Z) | Bounce fails below 1.8885, then a new low under 1.8749 | Break above 1.8885 |
| Bearish | The decline from 1.8885 was the start of a larger drop | Five-wave move below 1.8685 toward the 1.8676 range low | Price holds above 1.8749 |
The primary count carries the most weight because the reaction came fast and from the exact zone. Corrections can stretch from 7 swings to 11 without warning, which makes the alternate count the main risk.
When the Equal Legs Setup Fails
- A close beyond 123.6%: the correction is likely more complex, often a triple three or expanded flat.
- A weak bounce: no 50% retracement of the last leg within a few sessions.
- Five waves into the zone: that is an impulse, not a correction.
- No momentum divergence: RSI or MACD keeps making new lows along with price.
- Major news during the test: central bank decisions can push price straight through levels.
Fundamentals Behind the GBP/CAD Forecast
Interest rates favour the pound while high oil prices favour the Canadian dollar. That tension explains GBPCAD’s narrow range and makes the next two weeks of data important for the wave count.
Bank of England vs. Bank of Canada Policy
| Bank of England | Bank of Canada | |
|---|---|---|
| Policy rate | 3.75% | 2.25% |
| Last decision | Held on September 17, 2026 (6 to 3; three votes for 4.00%) | Held at every meeting since October 29, 2025 |
| Latest CPI | 3.1% (UK) | 3.0% (Canada, August) |
| Next decision | November 5, 2026 | October 28, 2026 |

The 150 basis point gap supports GBP. The Bank of England says it is more likely to raise Bank Rate if volatile energy prices persist, and three members already voted for a hike in September. In Canada, a much weaker-than-expected September jobs report sent the loonie toward its weakest levels since April 2025.
How Crude Oil Moves the Canadian Dollar
Petroleum is Canada’s largest export, so rising oil tends to lift CAD and push GBPCAD lower. Brent traded just below $105 a barrel on October 14 on Middle East supply concerns. A drop in crude would remove a key support for CAD and help the bullish count.
Upcoming Data to Watch (US Eastern Time)
| Date | Event | Why it matters |
|---|---|---|
| Mon, Oct 19, 8:30 a.m. | Canada CPI (September) | Last major Canadian data before the BoC |
| Wed, Oct 21, 2:00 a.m. | UK CPI (September) | A hot print raises odds of a BoE hike |
| Wed, Oct 28, 9:45 a.m. | Bank of Canada decision and Monetary Policy Report | A cut would weaken CAD |
| Thu, Nov 5 | Bank of England decision and Monetary Policy Report | A hike would support GBP |
A five-bank survey by MTFX puts the October GBP/CAD range at roughly 1.83 to 1.90.
Correlated Pairs to Confirm the Setup
GBPCAD equals GBPUSD multiplied by USDCAD, so the bullish count is strongest when both of those pairs rise together. Falling WTI crude and a broad CAD selloff, visible in EURCAD, add confirmation. If GBPUSD rallies while USDCAD falls, GBPCAD can stall even with a clean wave count.
GBPCAD Pair Profile for Traders
- Daily range: about 78 pips on average across October 2 to 9, 2026, based on ExchangeRates.org.uk history. The 81-pip equal legs zone is roughly one day of movement.
- Most active hours: the London and New York overlap, about 8:00 a.m. to noon ET.
- Event risk: UK data lands at 2:00 a.m. ET, and Canadian data at 8:30 a.m. ET, so overnight gaps can hit tight stops.
FAQS
What is the equal legs area in Elliott Wave?
It is the zone where the second leg of a correction equals the first leg in length, measured at 100% to 123.6% of the first leg and projected from the end of the middle wave.
How do you calculate equal legs with Fibonacci?
Use a Fibonacci extension tool. Click the start and end of the first leg, then the end of the connector wave. The 1.0 and 1.236 lines mark the zone.
Is GBPCAD bullish right now?
The short-term count is bullish while price holds above 1.8685. A daily close above 1.8885 would confirm the next leg higher; a break below 1.8685 would weaken it.
What is a W-X-Y correction?
A W-X-Y, or double three, is two simple corrections (W and Y) joined by a connector wave (X). It usually unfolds in 7 swings.
Which timeframe works best for Elliott Wave on GBPCAD?
Use the daily chart for trend, the 4-hour chart for the setup and the 1-hour chart for entry timing. This setup was spotted and traded on the 1-hour chart.
Free Elliott Wave e-books
 FREE
Elliott Wave Forecasting Guide
A clear introduction to forecasting markets with the Elliott Wave Principle.
Get the free e-book FREE
Elliott Wave Trading Strategies
Practical setups for entries, stops and exits using wave structure.
Get the free e-book FREE
Beginner's Guide to Forex Trading
Forex basics for new traders: pairs, pips, lots, sessions and risk.
Get the free e-book FREE
Guide to Trading Stocks and ETFs
How stock and ETF markets work and how to read them with wave analysis.
Get the free e-bookFree download after a short sign-up with the publisher.
Educational content only. Nothing on this page is financial advice or a recommendation to buy or sell. Trading involves risk and you can lose money. Elliott Wave counts are probabilities, not certainties. Read our full disclaimer and affiliate disclosure.