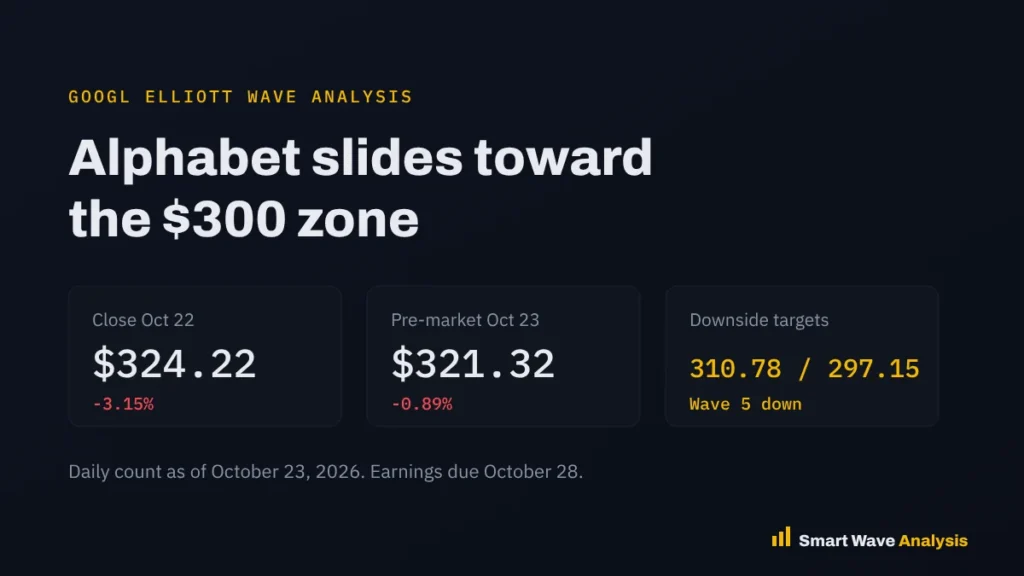
Alphabet (GOOGL) fell 3.15% to $324.22 on October 22, 2026 and traded near 321.32 in pre-market on October 23. That is about 20.7% below its 52-week high of 408.61. On our daily chart, the stock is in wave 5 down, the last leg of the decline from the August 5 high at 384.48. The targets are 310.78 and 297.15, and the bearish view stays valid while price holds below 359.40. Count date: October 23, 2026.
Alphabet heads into its third quarter report on October 28 with the stock under pressure. This post explains why big tech sold off, what to watch in the earnings, and where the Alphabet Elliott Wave analysis sees the next support.
Why Alphabet fell on October 22, 2026
Alphabet dropped $10.54 to $324.22 after trading between $322.00 and $331.43, according to Gotrade market data. There was no company specific news. The whole big tech group fell as worries about AI spending and the cost of money came back:
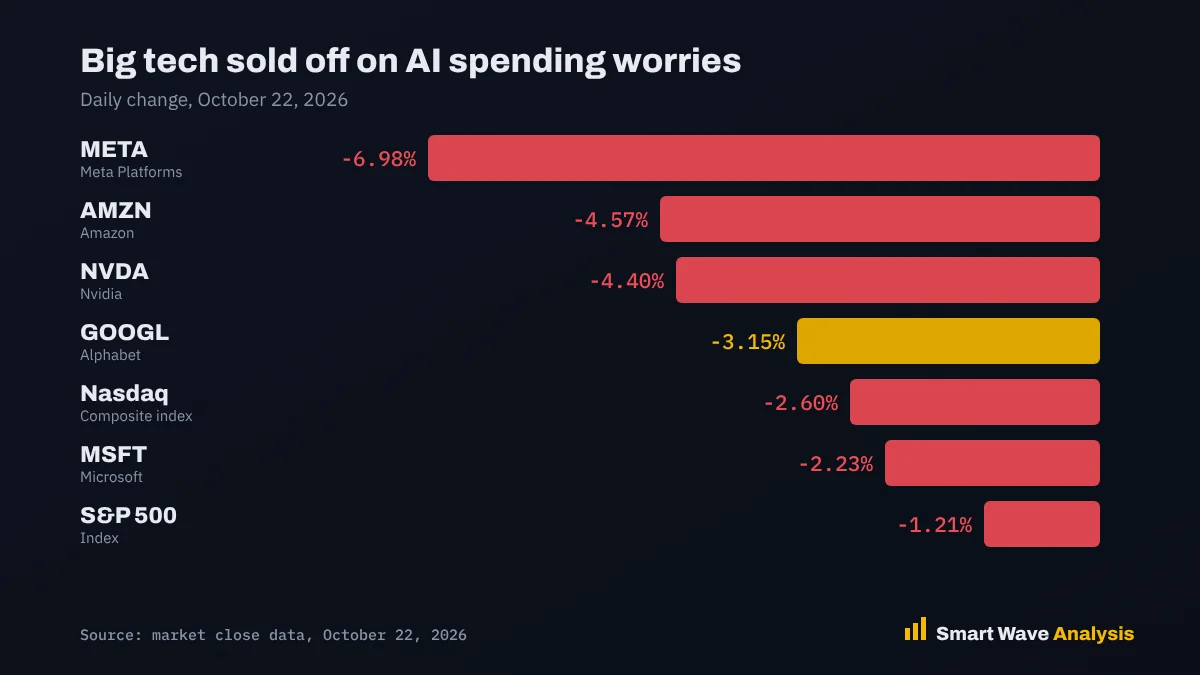
| Stock or index | Company | Daily change |
|---|---|---|
| META | Meta Platforms | -6.98% |
| AMZN | Amazon | -4.57% |
| NVDA | Nvidia | -4.40% |
| GOOGL | Alphabet | -3.15% |
| Nasdaq | Composite index | -2.60% |
| MSFT | Microsoft | -2.23% |
| S&P 500 | Index | -1.21% |
Meta set the tone after its results, when it raised the low end of its 2026 spending plan. Investors now question whether huge AI budgets will pay off. On the same day, Citizens JMP cut its price target on Alphabet to $450 from $515 while keeping its market outperform rating, as MarketBeat reported.
Alphabet’s own comments add to the debate. In an October 20 interview, chief executive Sundar Pichai said Google Cloud is giving up some short term revenue so that Google DeepMind gets first claim on computing power. He called those compute needs “non-negotiable.”
What to watch in the October 28 earnings
The last report was strong. Revenue for the second quarter of 2026 reached $119.8 billion, up about 24% from a year earlier and ahead of the $117.07 billion consensus. Google Cloud grew 82% in that quarter, a figure that included sales of its TPU chip systems.
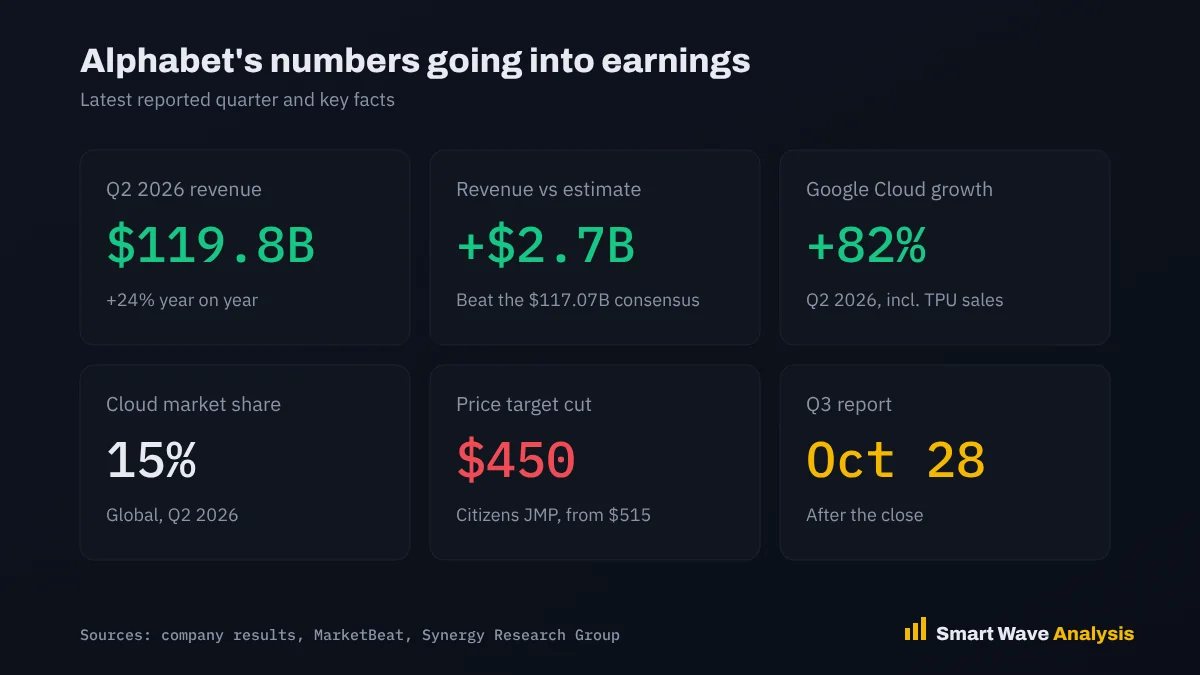
| Item | Figure | Why it matters |
|---|---|---|
| Q2 2026 revenue | $119.8B | Up about 24% year on year |
| Consensus for Q2 | $117.07B | Alphabet beat by about $2.7 billion |
| Google Cloud growth | +82% | Includes TPU system sales |
| Cloud market share | 15% | Global cloud infrastructure, Q2 2026 |
| Q3 report | Oct 28 | After the market close |
Three things will decide the reaction: Cloud growth, the size of the spending plan for 2027, and any sign that AI is lifting search revenue. Strong numbers can still lead to a drop if spending rises faster than sales, which is exactly what hit Meta this week.
GOOGL Elliott Wave count
Alphabet peaked at its 52-week high of 408.61 and then made a lower high at 384.48 on August 5, 2026. Our daily count reads the fall from that lower high as a five-wave decline:
- Waves 1 and 2: the first drop from 384.48 and a small bounce that failed well below the start.
- Wave 3: the longest and fastest leg, down to the 314.90 area.
- Wave 4: the bounce to 359.40. It stayed below the wave 1 low, so the impulse rules hold.
- Wave 5: the decline from 359.40 that is now in progress. A move below 314.90 would confirm the new low.
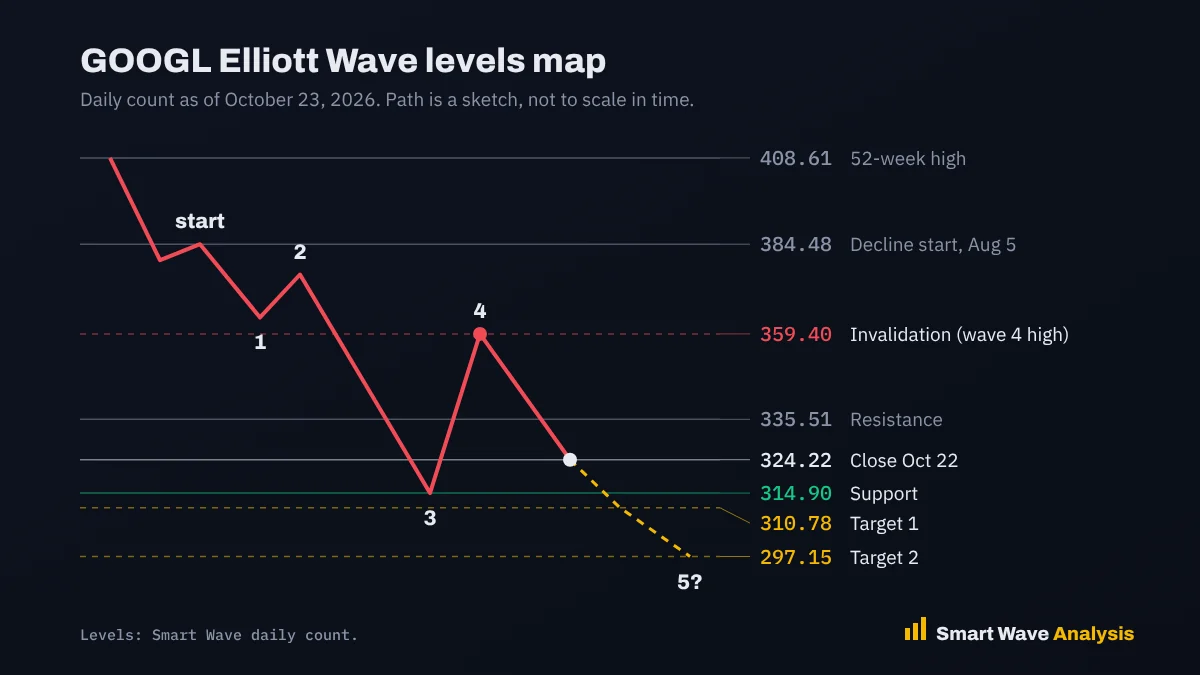
The first target at 310.78 sits just below the 314.90 support, where wave 5 would make a new low. The second target at 297.15 brings price into the $300 zone. A drop to that area would put Alphabet about 27% below its 52-week high, a normal size for a larger correction after a long rally. You can check the projections with our Elliott Wave target calculator and Fibonacci calculator.
| Level | Price | Why it matters |
|---|---|---|
| Invalidation | 359.40 | Wave 4 high. A close above it cancels the bearish count |
| Resistance | 335.51 | Nearest swing high above price |
| Last close | 324.22 | October 22, 2026 |
| Support | 314.90 | Wave 3 low. A break below confirms wave 5 |
| Target 1 | 310.78 | First target for wave 5 |
| Target 2 | 297.15 | Second target, inside the $300 zone |
What this means for the Nasdaq 100
Alphabet is one of the largest companies in the Nasdaq 100, with a market value of about $3.94 trillion. Its earnings on October 28 come in the same busy week as other big tech reports, so the index could see large swings. For the bigger picture, see our Nasdaq 100 Elliott Wave analysis and the QQQ page.
Trade plan
- Bearish viewSell bounces toward 330 to 335 while price stays below 335.51, with a stop above 335.51. The wider stop for a swing trade sits above 359.40.
- Targets310.78, then 297.15. Take some profit near 310.78, since fifth waves end the trend.
- Earnings riskThe October 28 report can gap the stock past any level. Reduce position size or wait until after the report.
- RiskSize each trade so a stop costs only 1% to 2% of your account. Our position size calculator does the math.
Want the next Alphabet count before the move?
Get professional Elliott Wave analysis with updated charts, clear targets and invalidation levels for stocks, indices, forex, commodities and crypto.
- Daily chart updates
- Entry and stop levels
- Several timeframes
Frequently asked questions
Why did Alphabet stock fall on October 22, 2026?
There was no Alphabet specific news. The stock fell 3.15% with other big tech names as worries about AI spending returned, and Citizens JMP cut its price target to $450 from $515.
What is the GOOGL Elliott Wave target?
Our daily count puts Alphabet in wave 5 down from the August 5 high at 384.48, with targets at 310.78 and 297.15. That makes the $300 area the main zone to watch.
What would cancel the bearish GOOGL count?
A daily close above 359.40, the wave 4 high, would cancel it. A close above 335.51 would be the first warning.
When does Alphabet report earnings?
Alphabet reports its third quarter 2026 results after the close on October 28, 2026. Earnings can move the stock sharply in either direction.
Sources
- Alphabet Investor Relations: quarterly results and earnings dates
- Gotrade: Google stock news and market data (October 23, 2026)
- MarketBeat: Alphabet price target cut and Q2 results (October 22, 2026)
This analysis is for education and is not financial advice. Elliott Wave counts are probabilities, not certainties. Read our risk disclaimer.
Free Elliott Wave e-books
 FREE
Elliott Wave Forecasting Guide
A clear introduction to forecasting markets with the Elliott Wave Principle.
Get the free e-book FREE
Elliott Wave Trading Strategies
Practical setups for entries, stops and exits using wave structure.
Get the free e-book FREE
Beginner's Guide to Forex Trading
Forex basics for new traders: pairs, pips, lots, sessions and risk.
Get the free e-book FREE
Guide to Trading Stocks and ETFs
How stock and ETF markets work and how to read them with wave analysis.
Get the free e-bookFree download after a short sign-up with the publisher.
Educational content only. Nothing on this page is financial advice or a recommendation to buy or sell. Trading involves risk and you can lose money. Elliott Wave counts are probabilities, not certainties. Read our full disclaimer and affiliate disclosure.