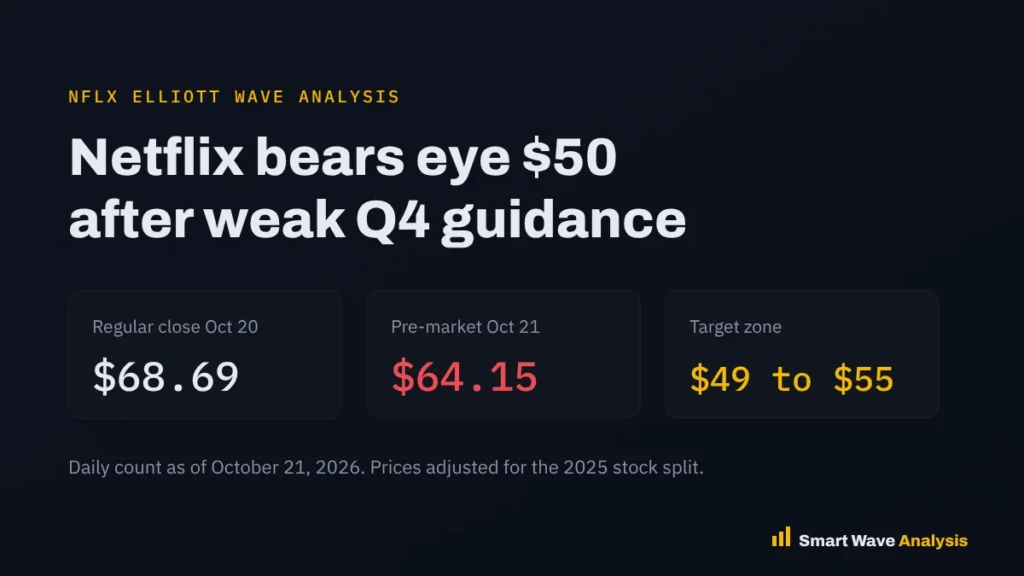
Netflix (NFLX) is in wave (5) down on our daily chart, the last leg of the decline from the 52-week high at 124.86. The stock closed at 68.69 on October 20, 2026 and traded near 64.15 in pre-market on October 21, below the July low of 65.08. Our targets are 55.23 and 49.14. The bearish count stays valid while price holds below 81.02. Count date: October 21, 2026.
Netflix beat profit estimates for the third quarter, but its fourth quarter outlook came in below what analysts expected. The stock dropped after hours and is now testing the bottom of its yearly range. This post explains the numbers, the Netflix Elliott Wave analysis and the levels that decide the next move. All prices are adjusted for the 10-for-1 stock split of November 2025.
What Netflix reported on October 20, 2026
Netflix posted revenue of $12.874 billion for the third quarter, up about 12% from a year earlier and almost exactly in line with the consensus of $12.876 billion. Earnings per share came in at $0.87, ahead of the $0.82 estimate. The operating margin was 34.6%, well above the 28.2% of a year ago, though the company said much of the beat came from the timing of expenses.
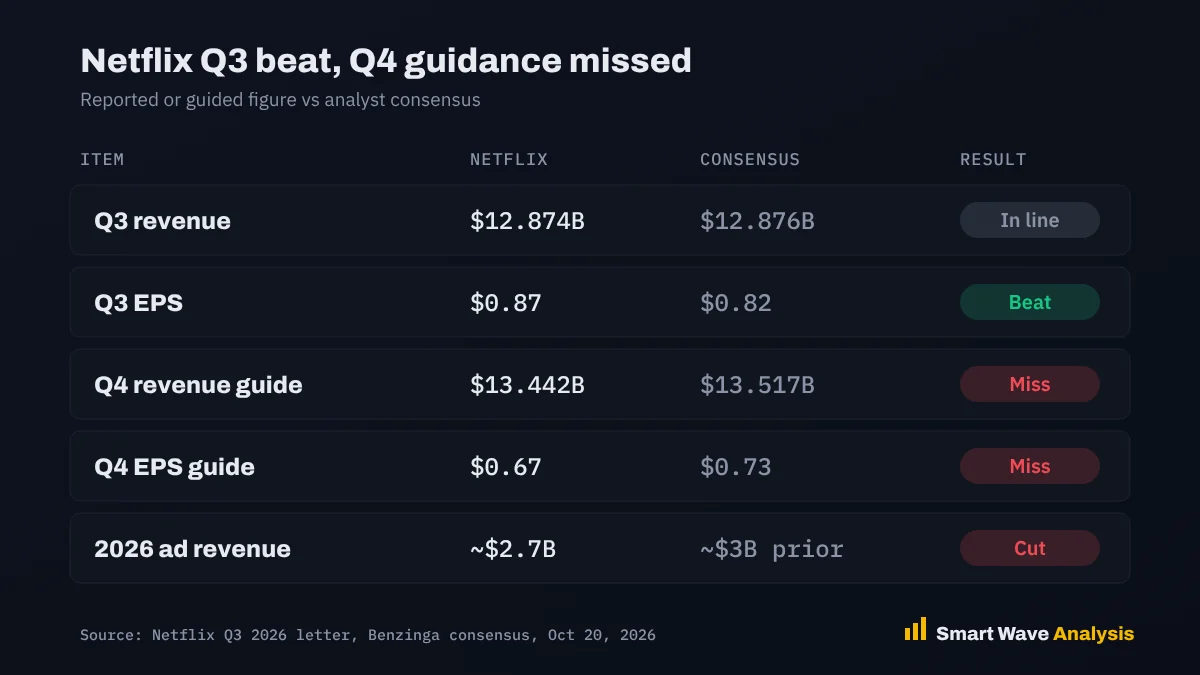
The problem was the outlook:
| Item | Netflix | Consensus | Result |
|---|---|---|---|
| Q3 revenue | $12.874B | $12.876B | In line |
| Q3 EPS | $0.87 | $0.82 | Beat |
| Q4 revenue guidance | $13.442B | $13.517B | Miss |
| Q4 EPS guidance | $0.67 | $0.73 | Miss |
| 2026 ad revenue | About $2.7B | About $3B (prior company view) | Cut |
| 2026 free cash flow | About $12.0B | About $12.5B (prior company view) | Cut |
Netflix kept its full year revenue forecast at $51.1 billion, inside its earlier range of $51.0 billion to $51.4 billion. It said the ad business is growing more slowly than planned because some ad tools are rolling out later than expected. The fourth quarter margin forecast of 26% also includes about 1.2 points of cost from a workforce cut of roughly 6% made the week before the report.
A record buyback that was larger than cash flow
Netflix bought back $4.797 billion of its own stock in the quarter, about 63.9 million shares. That was its largest buyback quarter ever. Free cash flow for the same period was $2.884 billion, so the company spent about $1.9 billion more on buybacks than it generated.
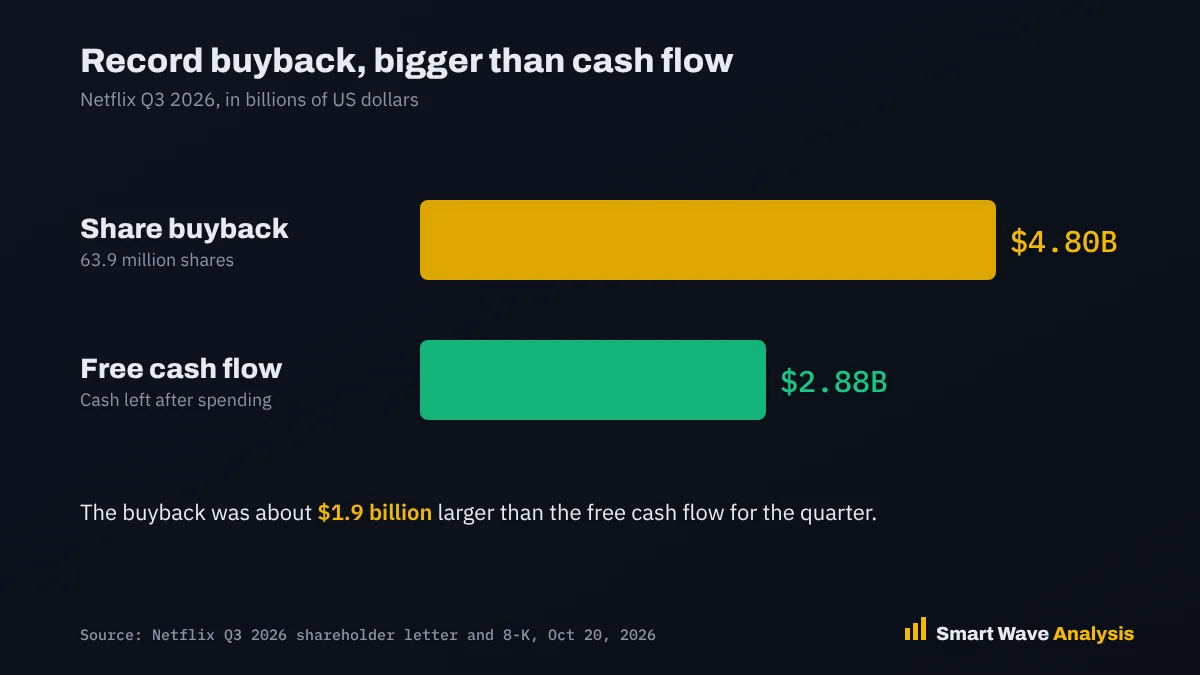
Buybacks usually help a stock. This time, even the largest buyback in company history could not hold the price above the July low, which tells us sellers are in control for now.
Netflix Elliott Wave count
The decline from the 124.86 high is the larger trend on the daily chart. Our primary count reads it as a five-wave move down:
- Waves (1) to (3): the fall from 124.86 to the July 17, 2026 low at 65.08, a drop of almost 48%.
- Wave (4): the bounce from 65.08 to 81.02. It recovered only about 27% of the prior decline, which is a shallow and typical fourth wave.
- Wave (5): the decline from 81.02 that is now in progress. The earnings gap below 65.08 fits a fifth wave that makes a new low.
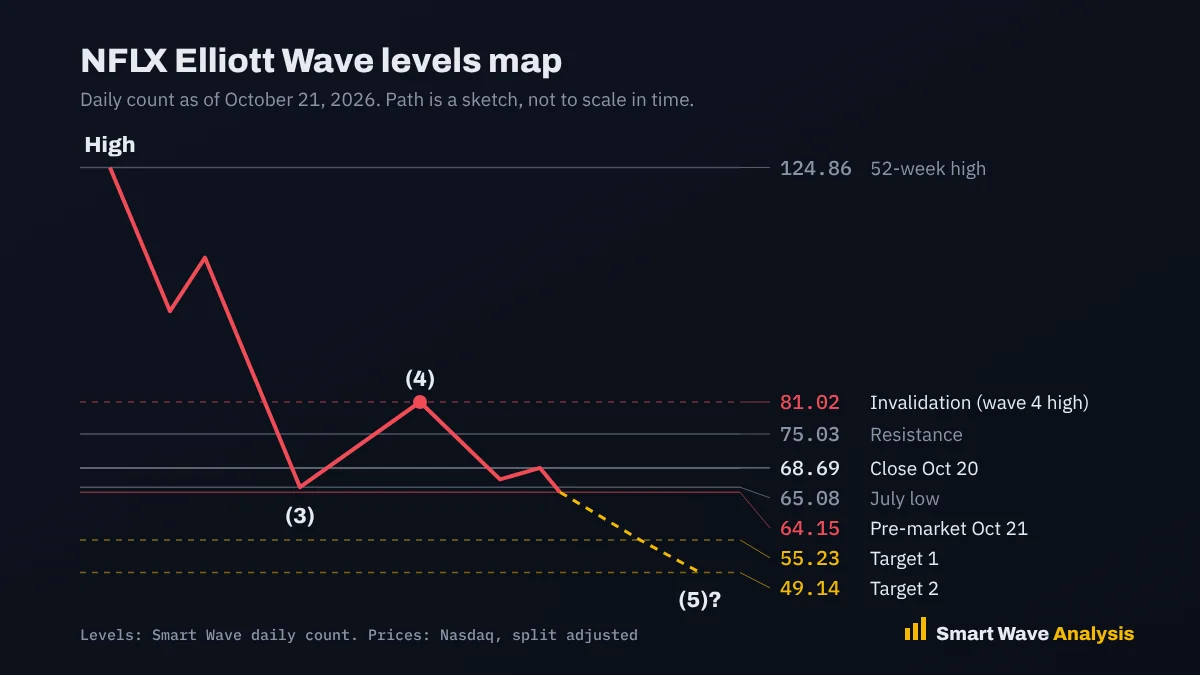
To get the targets, we measured the wave (4) bounce (65.08 to 81.02, a move of 15.94) and projected it down from the 81.02 top. The 161.8% projection gives 55.23, and the 200% projection gives 49.14. That makes 49 to 55 the zone where wave (5) could end, with the round $50 level in the middle. You can check the math with our Fibonacci calculator and Elliott Wave target calculator.
| Level | Price | Why it matters |
|---|---|---|
| Invalidation | 81.02 | Wave (4) high. A break above means the bearish count is wrong |
| Resistance | 75.03 | Nearest swing high inside wave (5) |
| Last close | 68.69 | October 20, 2026, before the earnings reaction |
| Breakdown | 65.08 | July low and 52-week low. A daily close below it confirms the new low |
| Target 1 | 55.23 | 161.8% projection of the wave (4) bounce |
| Target 2 | 49.14 | 200% projection of the wave (4) bounce |
Why the gap below 65.08 matters
The pre-market price is not a close. A gap can fill during the session, so the bearish signal is confirmed only by a daily close below 65.08. If Netflix closes back above that level and holds there for a few days, the break is weaker and the alternate count gains weight. Watch the first session after earnings closely, since it often sets the tone for the following weeks.
What this means for the Nasdaq 100
Netflix is one of the larger members of the Nasdaq 100. A weak media and tech name adds pressure to an index that just had its steepest weekly loss in more than a year. For the bigger picture, see our Nasdaq 100 Elliott Wave analysis and the QQQ page.
Trade plan
- Bearish viewAfter a daily close below 65.08, look for a bounce toward 68 to 72 to sell into, with a stop above 75.03. The wider stop for a position trade sits above 81.02.
- Targets55.23, then 49.14. Taking some profit near 55 is sensible because fifth waves end the trend.
- BuyersWait. The 49 to 55 zone is where a long-term low could form, but only a clear five-wave rise from that area would signal it.
- RiskSize each trade so a stop costs only 1% to 2% of your account. Our position size calculator does the math.
Frequently asked questions
Why did Netflix stock fall after earnings?
Netflix beat profit estimates for the third quarter, but its fourth quarter revenue and earnings forecasts were below analyst estimates. The company also cut its 2026 ad revenue and free cash flow outlook.
What is the Netflix Elliott Wave target?
Our daily count puts Netflix in wave (5) down, with targets at 55.23 and 49.14. The $50 area sits inside that zone.
What would cancel the bearish Netflix count?
A move above 81.02, the wave (4) high, would cancel it. A daily close back above 75.03 would be the first warning. We update the count on the Netflix page when the structure changes.
Why is Netflix stock near $68 and not $680?
Netflix split its stock 10-for-1 in November 2025. Every price in this post, including the 124.86 high, is adjusted for that split.
Sources
- Netflix Investor Relations: Q3 2026 shareholder letter
- Benzinga: Netflix Q3 highlights and consensus figures (October 20, 2026)
- StockTitan: Netflix Q3 2026 earnings and 2026 outlook
- SEC EDGAR: Netflix 8-K filings
This analysis is for education and is not financial advice. Elliott Wave counts are probabilities, not certainties. Read our risk disclaimer.
Free Elliott Wave e-books
 FREE
Elliott Wave Forecasting Guide
A clear introduction to forecasting markets with the Elliott Wave Principle.
Get the free e-book FREE
Elliott Wave Trading Strategies
Practical setups for entries, stops and exits using wave structure.
Get the free e-book FREE
Beginner's Guide to Forex Trading
Forex basics for new traders: pairs, pips, lots, sessions and risk.
Get the free e-book FREE
Guide to Trading Stocks and ETFs
How stock and ETF markets work and how to read them with wave analysis.
Get the free e-bookFree download after a short sign-up with the publisher.
Educational content only. Nothing on this page is financial advice or a recommendation to buy or sell. Trading involves risk and you can lose money. Elliott Wave counts are probabilities, not certainties. Read our full disclaimer and affiliate disclosure.