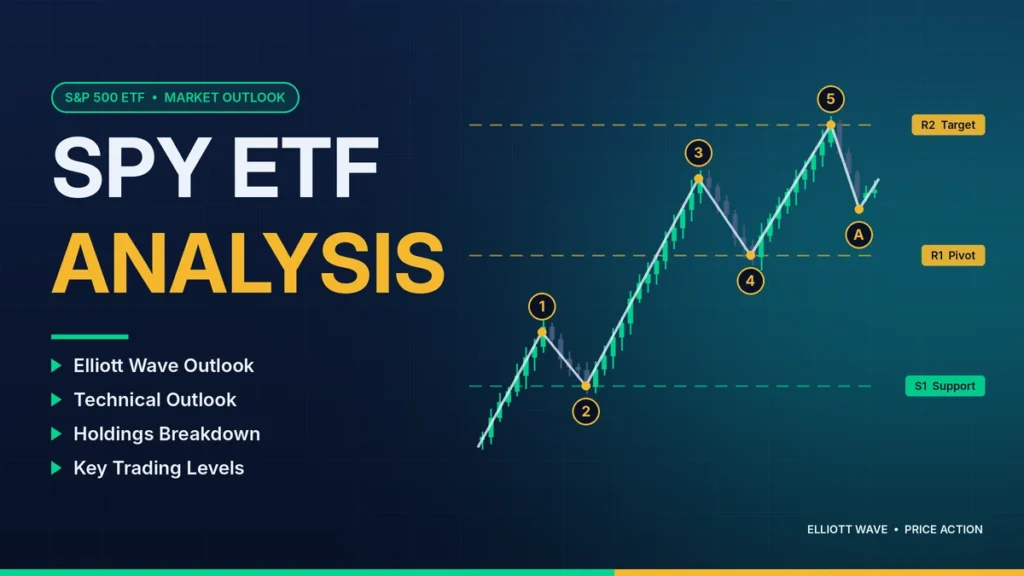
What Is SPY ETF?
SPY is the ticker symbol for the State Street SPDR S&P 500 ETF Trust, an exchange-traded fund designed to track the performance of the S&P 500 Index before fees and expenses. The fund seeks to provide investment results that generally correspond to the price and yield performance of the S&P 500 Index.
Launched on January 22, 1993, SPY was the first US-listed exchange-traded fund. It trades on NYSE Arca under the ticker symbol SPY and remains one of the most widely followed instruments for tracking large-cap US equities.
Unlike an individual stock, SPY represents ownership in a portfolio of companies included in the S&P 500. The underlying index uses a float-adjusted market-capitalization weighting methodology, meaning companies with larger publicly available market values generally have a larger impact on index performance.
For traders, SPY is important because it provides exposure to the broad US equity market while offering high liquidity, active options trading, and price movement that closely reflects large-cap market conditions. At Smart Wave Analysis, we focus on identifying market cycles, wave structures, and key technical levels using a rules-based analytical approach.
SPY ETF Key Facts
| Category | Details |
|---|---|
| Ticker | SPY |
| Fund Name | State Street SPDR S&P 500 ETF Trust |
| Issuer | State Street Global Advisors |
| Benchmark | S&P 500 Index |
| Exchange | NYSE Arca |
| Inception Date | January 22, 1993 |
| Structure | Unit Investment Trust |
| Expense Ratio | 0.0945% |
| Distribution Frequency | Quarterly |
| Options Available | Yes |
Sources: State Street fund documents and SEC filings.
SPY’s structure is different from many modern ETFs because it operates as a Unit Investment Trust. The SEC prospectus identifies SPY as a registered exchange-traded fund whose units trade on NYSE Arca.
How Does SPY Track the S&P 500?
The S&P 500 Index represents a broad segment of large-capitalisation U.S. companies across multiple industries. State Street describes the benchmark as a float-adjusted, market-capitalization-weighted index covering companies across all eleven GICS sectors.
When the largest companies in the index rise or fall, SPY generally reflects that movement because those companies carry greater index weight.
This relationship makes SPY useful for:
• Long-term investors seeking broad US equity exposure
• Traders analyzing overall market direction
• Technical analysts studying large-cap market cycles
🚀 Don’t Miss the Next Move
Get daily Elliott Wave counts, live chart updates, and high-probability trade setups across crypto, forex, and stocks — before the market moves.
👉 Start Your 14-Day Trial for Just $0.99 →Cancel anytime. No long-term commitment. (Affiliate link — we may earn a commission at no extra cost to you.)
SPY vs S&P 500 Index (SPX)
Although SPY follows the S&P 500, the two are not identical instruments.
| SPY | SPX |
|---|---|
| Exchange-traded fund | Stock market index |
| Trades during market hours | Index value calculation |
| Includes ETF expenses | No fund expenses |
| Pays distributions | Does not pay ETF distributions |
| Has options trading | Has index options |
Technical traders often compare SPY charts with SPX and S&P 500 futures because each market can provide different information depending on the trading timeframe.
SPY vs VOO vs IVV
SPY competes with other S&P 500 ETFs such as Vanguard S&P 500 ETF (VOO) and iShares Core S&P 500 ETF (IVV).
The main differences are:
| ETF | Primary Difference |
|---|---|
| SPY | High liquidity and extensive options market |
| VOO | Popular lower-cost S&P 500 ETF |
| IVV | Popular S&P 500 ETF from iShares |
For active traders, liquidity and options availability are often major considerations. For long-term investors, expense ratios and investment objectives are commonly reviewed.
SPY Holdings and Market Drivers
Because SPY follows a market capitalization-weighted index, the largest companies have a significant influence on price movement.
Major SPY holdings typically include companies such as:
• Nvidia
• Apple
• Microsoft
• Amazon
• Alphabet
• Meta Platforms
• Broadcom
The exact weights change over time as stock prices move and index adjustments occur.
SPY Sector Exposure
SPY provides exposure across all eleven GICS sectors:
• Information Technology
• Financials
• Health Care
• Consumer Discretionary
• Communication Services
• Industrials
• Consumer Staples
• Energy
• Utilities
• Real Estate
• Materials
Sector concentration matters because SPY performance can be affected by leadership from specific parts of the market, particularly large technology companies.
SPY Technical Analysis
Technical analysis of SPY focuses on price structure, momentum, volume, and market behavior.
Key areas traders commonly evaluate include:
• Trend direction
• Higher highs and higher lows
• Support and resistance zones
• Moving averages
• Momentum indicators
• Volume confirmation
• Market breadth
A rising sequence of higher highs and higher lows generally indicates positive price structure, while repeated lower highs and lower lows can signal weakening momentum.
SPY Trend Structure
Important technical references include:
20-day EMA
Often used to monitor short-term momentum.
50-day moving average
Commonly used to identify intermediate trend conditions.
200-day moving average
Frequently followed as a long-term market trend reference.
A technical analysis approach does not rely on one indicator alone. Price structure, momentum, and volume should be evaluated together.
SPY Support and Resistance Levels
Support and resistance levels are price areas where buyers or sellers have previously influenced market behavior.
Common methods include:
• Previous swing highs and lows
• Fibonacci retracement levels
• Moving averages
• Volume-based price zones
For Elliott Wave analysis, these areas become especially important because they help define where a wave count remains valid or where an alternative scenario becomes more likely.
SPY Elliott Wave Analysis
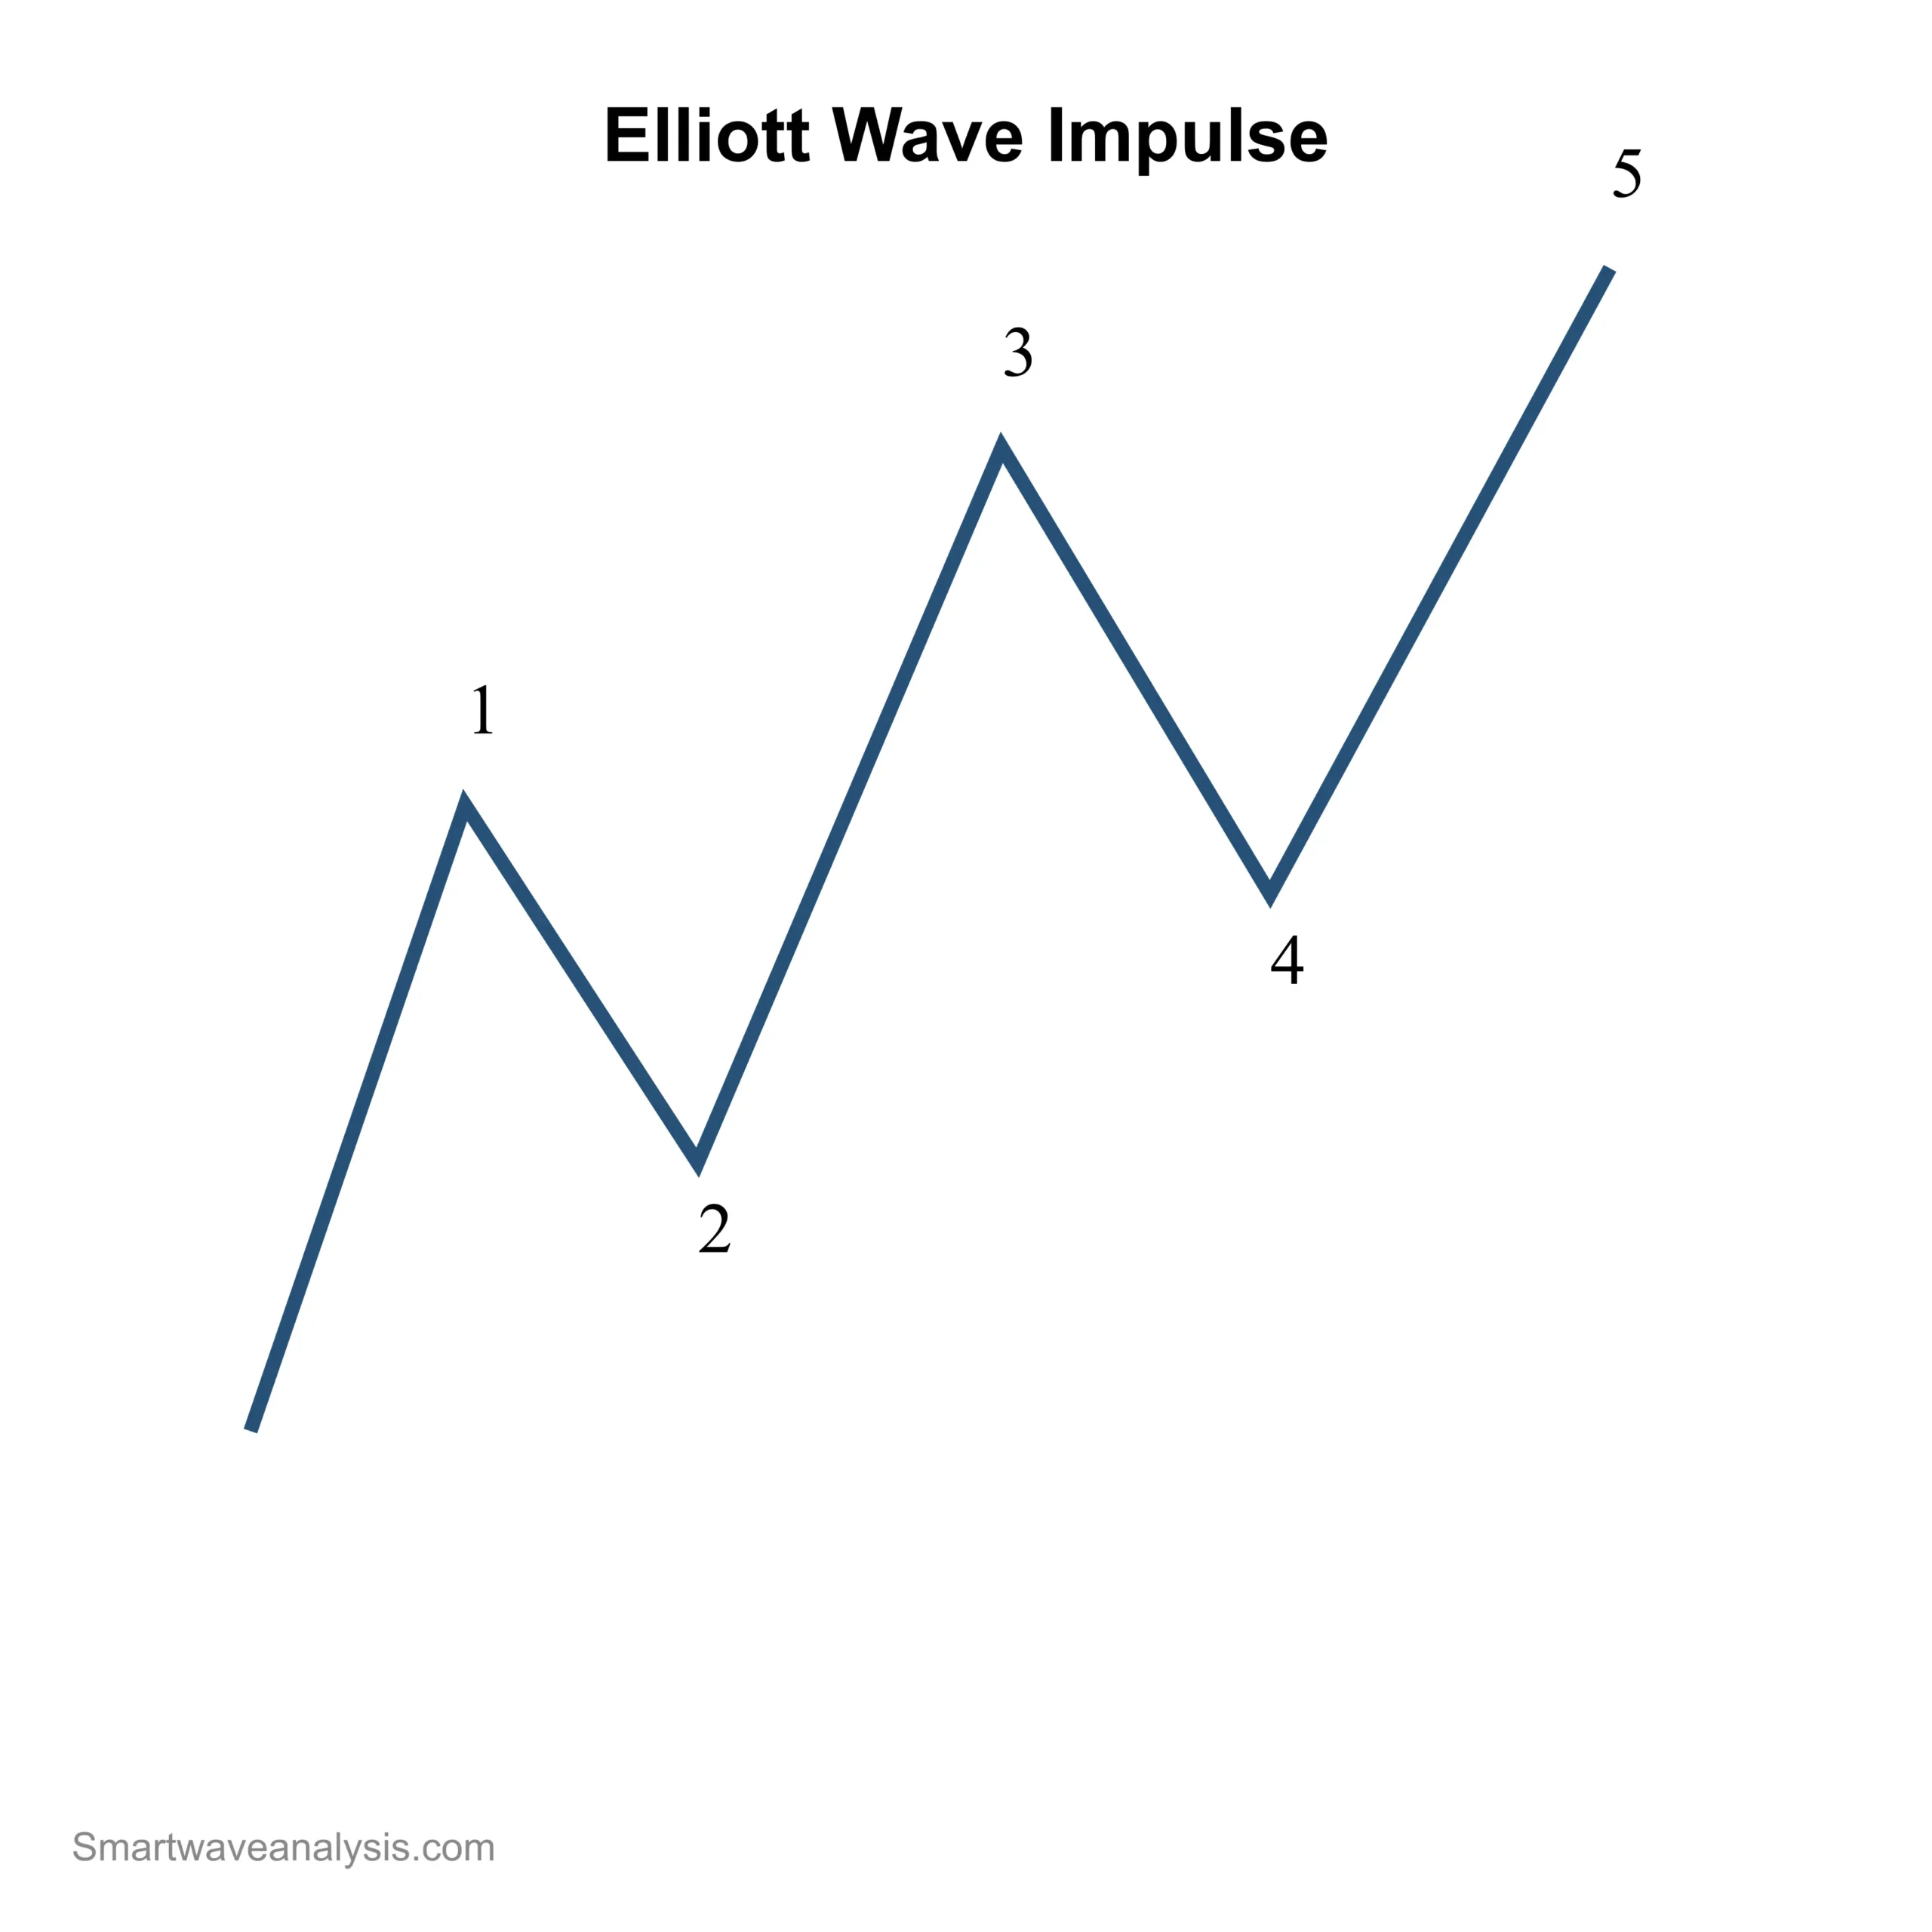
Elliott Wave analysis studies repeating market patterns created by changes in investor sentiment.
The basic Elliott Wave model consists of:
• Five-wave impulse structures during trends
• Three-wave corrective structures against trends
Common corrective patterns include:
• Zigzag corrections
• Flat corrections
• Triangles
• Combination patterns
The value of an Elliott Wave count is not only the forecast direction. A complete analysis should define:
• Current wave position
• Expected path
• Confirmation level
• Invalidation level
• Alternative scenario
Current SPY Elliott Wave Count
A professional Elliott Wave analysis begins by identifying the market degree being analyzed.
A typical framework may include:
Weekly chart
Used to identify the larger market cycle.
Daily chart
Used to define the intermediate trend structure.
Four-hour and hourly charts
Used for shorter-term wave development and trading levels.
A premium Elliott Wave service has published SPY analysis using corrective structures, Fibonacci relationships, and defined invalidation levels to identify potential turning zones.
Primary Elliott Wave Scenario
A bullish Elliott Wave scenario generally requires:
• A completed corrective structure
• Support holding at the expected Fibonacci zone
• Development of a new impulsive advance
• Breakout above important previous highs
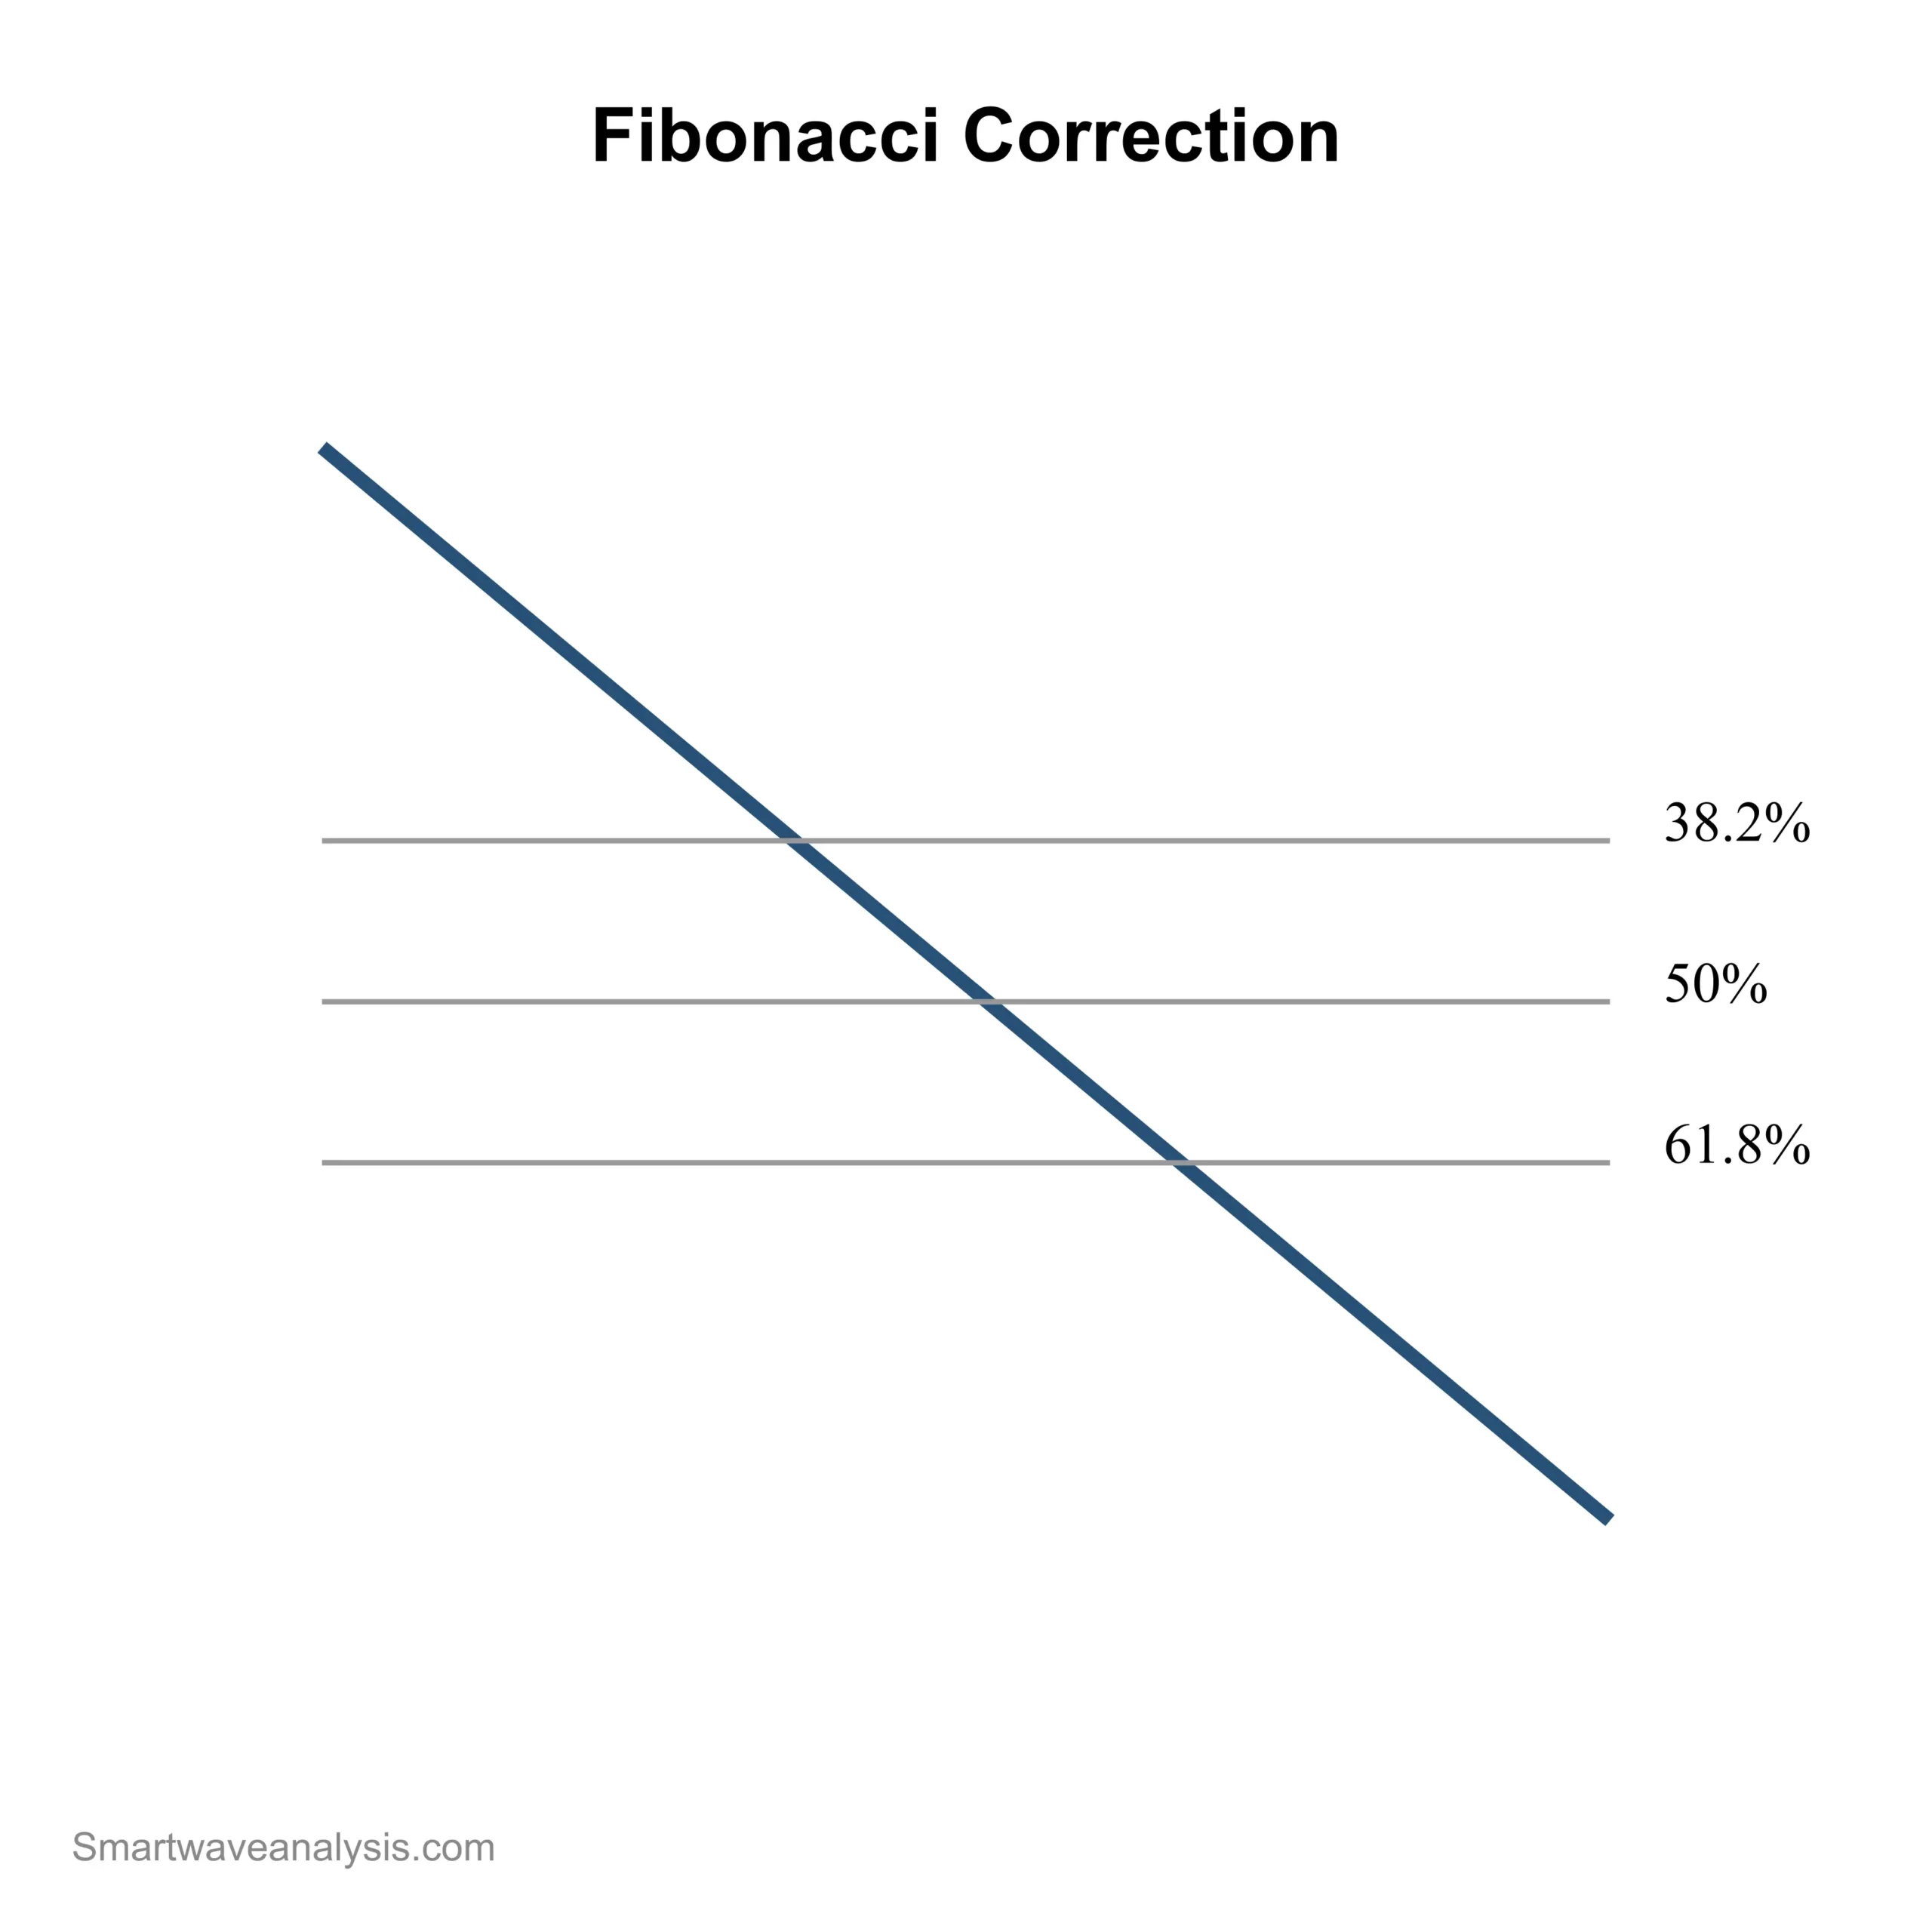
Fibonacci relationships commonly analyzed include:
• 38.2% retracement
• 50% retracement
• 61.8% retracement
• Equal leg projections
• Fibonacci extensions
The exact price levels depend on the current SPY chart structure and should be updated as market data changes.
Alternate Elliott Wave Scenario
A complete technical outlook must also define what would invalidate the primary count.
An alternate scenario may develop if:
• Key support levels fail
• The expected corrective pattern extends
• Price violates the level that confirms the current wave interpretation
This approach prevents analysis from becoming dependent on one outcome.
Previous SPY Elliott Wave outlook Review
One important advantage of Elliott Wave analysis is that previous forecasts can be reviewed against actual market movement.
Historical SPY Elliott Wave reports have used concepts such as:
• Three-wave pullbacks
• Equal leg Fibonacci zones
• Reaction zone areas
• Corrective wave completion
A premium Elliott Wave service has documented SPY setups where price reached defined Fibonacci areas before reacting higher.
Reviewing previous forecasts helps traders evaluate methodology rather than focusing only on individual predictions.
SPY Trading Levels and Market Scenarios
Bullish Scenario
A bullish SPY scenario would typically require:
| Condition | Interpretation |
|---|---|
| Support holds | Buyers defend important price areas |
| Momentum improves | Trend strength increases |
| Previous highs break | Confirms upward continuation |
Bearish Scenario
A bearish scenario would typically involve:
| Condition | Interpretation |
|---|---|
| Support failure | Current structure weakens |
| Lower highs develop | Selling pressure increases |
| Momentum declines | Trend conditions deteriorate |
Markets can move through multiple scenarios, which is why defined risk levels are essential.
SPY ETF Risks and Limitations
Although SPY provides broad exposure to large US companies, investors should understand the risks.
Important considerations include:
• Equity market volatility
• Concentration in the largest companies
• Economic cycles
• Interest rate changes
• Inflation conditions
• Market valuation changes
• Potential tracking differences between SPY and the S&P 500
The SEC prospectus notes that ETF investors face risks including possible loss of principal.
Frequently Asked Questions About SPY ETF
What is SPY ETF?
SPY is the State Street SPDR S&P 500 ETF Trust, an ETF designed to track the performance of the S&P 500 Index before expenses.
Is SPY the same as the S&P 500?
No. SPY is an ETF that seeks to track the S&P 500 Index. The ETF has expenses, trades on an exchange, and distributes dividends.
Is SPY better than VOO?
SPY and VOO both provide exposure to the S&P 500. The choice depends on factors such as liquidity, trading activity, expense considerations, and investment goals.
Does SPY pay dividends?
Yes. SPY distributes income from its portfolio holdings, with distributions paid quarterly.
What is SPY Elliott Wave analysis?
SPY Elliott Wave analysis applies Elliott Wave principles to identify possible market structures, corrective patterns, Fibonacci relationships, and invalidation levels.
What are the key SPY support and resistance levels?
Support and resistance levels change as market conditions develop. Traders typically identify them using price structure, Fibonacci levels, volume, and previous market turning points.
Free Elliott Wave e-books
 FREE
Elliott Wave Forecasting Guide
A clear introduction to forecasting markets with the Elliott Wave Principle.
Get the free e-book FREE
Elliott Wave Trading Strategies
Practical setups for entries, stops and exits using wave structure.
Get the free e-book FREE
Beginner's Guide to Forex Trading
Forex basics for new traders: pairs, pips, lots, sessions and risk.
Get the free e-book FREE
Guide to Trading Stocks and ETFs
How stock and ETF markets work and how to read them with wave analysis.
Get the free e-bookFree download after a short sign-up with the publisher.
Educational content only. Nothing on this page is financial advice or a recommendation to buy or sell. Trading involves risk and you can lose money. Elliott Wave counts are probabilities, not certainties. Read our full disclaimer and affiliate disclosure.