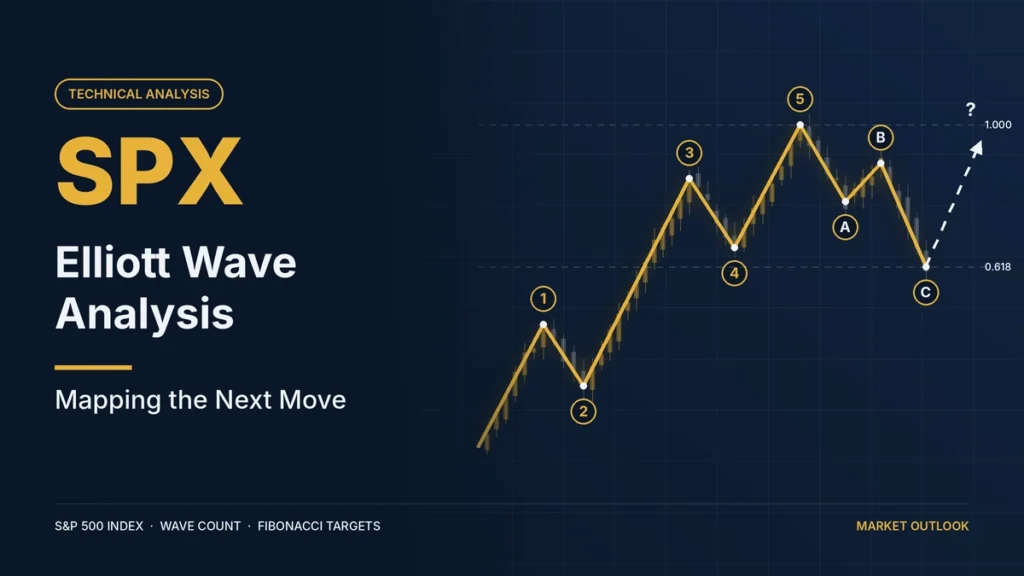
The S&P 500 closed at 7,722.72 on October 2, 2026, up 0.73% for the session. The index finished less than 1% below its record high after weaker US employment data reduced expectations for another immediate Federal Reserve rate increase.
From an Elliott Wave perspective, the near term question is whether the recent decline completed a corrective three wave structure or whether SPX still needs another leg lower before the larger advance resumes.
The preferred count treats the latest pullback as corrective while SPX holds above the 7,616.9 swing low. Above that level, resistance at 7,782.19 and the 7,816.70 record high defines the next test for buyers. A break below 7,616.9 would weaken that interpretation and shift attention toward support at 7,555 and 7,507.77.
SPX Elliott Wave Outlook at a Glance
As of the October 2 close, the short term Elliott Wave structure favors a completed correction above 7,616.9, followed by another attempt at the highs.
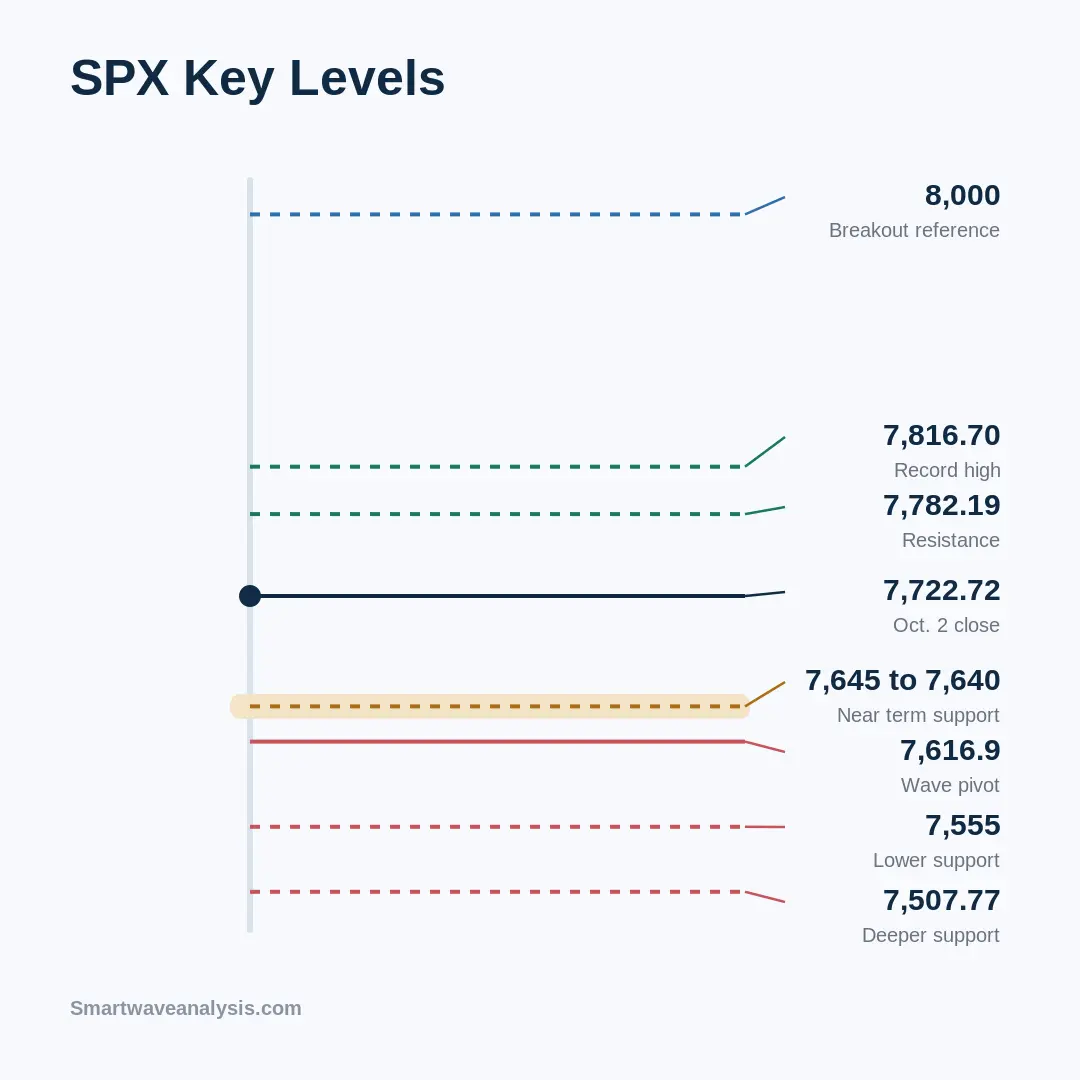
The main levels are straightforward.
Current SPX close: 7,722.72
Near term support: 7,645 to 7,640
Key wave pivot: 7,616.9
Lower support: 7,555
Deeper support: 7,507.77
First resistance: 7,782.19
Record high resistance: 7,816.70
Breakout reference: 8,000
Reuters technical analysis published September 30 identified 7,645 to 7,640 as support near the 50 day moving average, followed by 7,555 and 7,507.77. It placed resistance at 7,782.19 and the August high at 7,816.70, with 8,000 as the next major reference if SPX breaks higher.
Where SPX Sits in the Larger Elliott Wave Cycle
Weekly Elliott Wave Count
The larger SPX trend remains upward unless price begins breaking major higher degree support.
The rally has carried the index from the major 2025 lows to a record of 7,816.70 in 2026. That broader rise is consistent with an advancing Elliott Wave sequence, but the index is now close enough to the record high that traders should distinguish between continuation and a mature final wave.
Elliott Wave impulses contain five waves. One rule is that Wave 3 cannot be the shortest actionary wave. In a standard impulse, Wave 4 also cannot overlap Wave 1. Elliott Wave International identifies these as core rules used when testing whether a proposed impulse count is valid.
That means a wave label should follow price structure rather than being kept simply because it fits a bullish or bearish forecast.
Daily Elliott Wave Count
The daily structure remains constructive while the September and early October support area survives.
SPX reached 7,782.19 on September 22, then pulled back before recovering to 7,722.72 on October 2. The decline has not yet broken the deeper September support at 7,507.77.
For the preferred count, that behavior fits a correction inside the larger advance rather than a confirmed trend reversal.
Short Term SPX Elliott Wave Count
Four Hour Wave Structure
The current working count treats the decline from the recent highs as an ABC style correction.
The September 30 and October 1 premium Elliott Wave charts also identified the decline as a three wave pullback. Their Fibonacci projection placed an Equal Legs support area between 7,362.45 and 7,557.95. Price reacted above that broader zone and the October 2 update labeled 7,616.9 as the completed corrective low.
The stronger evidence now comes from what price does after that low.
If the correction is complete, SPX should continue forming higher lows and challenge the September resistance area. Failure to do so would leave the corrective structure open.
One Hour Wave Structure
On the one hour chart, 7,616.9 is the cleanest near term pivot.
Holding above it allows the rebound to develop into another advancing sequence. Breaking it would show that the recovery from the low failed to establish a durable higher low.
That distinction matters because Elliott Wave analysis is based on sequence and structure, not just direction.
Is the Current SPX Move Corrective or Impulsive?
The decline into the October low has so far been treated as corrective because it developed as a three wave move rather than a clear five wave bearish impulse.
A three wave decline normally supports a corrective interpretation. A clean five wave decline through established support would give the bearish case more weight.
🚀 Don’t Miss the Next Move
Get daily Elliott Wave counts, live chart updates, and high-probability trade setups across crypto, forex, and stocks — before the market moves.
👉 Start Your 14-Day Trial for Just $0.99 →Cancel anytime. No long-term commitment. (Affiliate link — we may earn a commission at no extra cost to you.)
Bullish SPX Elliott Wave Scenario
What Confirms the Bullish Count?
The first sign of confirmation would be sustained trade above 7,782.19.
The stronger signal would be a break above 7,816.70, which would remove the August record high as resistance and place SPX in price discovery.
SPX Upside Targets
The first objective is 7,782.19.
The second is 7,816.70.
If SPX clears the record high and holds above it, 8,000 becomes the next major price reference. Reuters also identified 8,000 as a possible objective following an upside breakout.
Further Fibonacci targets should be calculated from the confirmed swing structure once SPX establishes a breakout. Projecting distant extensions before confirmation would add precision without stronger evidence.
Bullish Count Invalidation
For the short term count used here, a break below 7,616.9 would invalidate the idea that the latest corrective low is already complete.
That would not automatically confirm a major bear trend. It would mean the correction is still developing.
Bearish SPX Elliott Wave Scenario
What Would Trigger the Alternate Count?
A sustained break below 7,616.9 would activate the alternate view.
The next question would be whether sellers can break the support structure beneath that level.
SPX Downside Targets
The first lower reference is 7,555.
Below that, 7,507.77 becomes the next meaningful support.
The 7,507.77 level also marks the September 16 low in the historical price data.
A decisive break beneath that area would make a simple completed three wave correction less convincing and increase the chance that a larger corrective pattern is unfolding.
When the Alternate Count Becomes Preferred
The alternate count becomes stronger if SPX breaks 7,616.9, fails to recover it, and continues through 7,555.
A move below 7,507.77 would provide stronger structural evidence that the correction has expanded beyond the latest short term wave pattern.
Fibonacci Levels Supporting the SPX Wave Count
Equal Legs Target
Equal Legs analysis compares the size of one corrective leg with another. In an ABC correction, analysts often project Wave C from the end of Wave B using the length of Wave A.
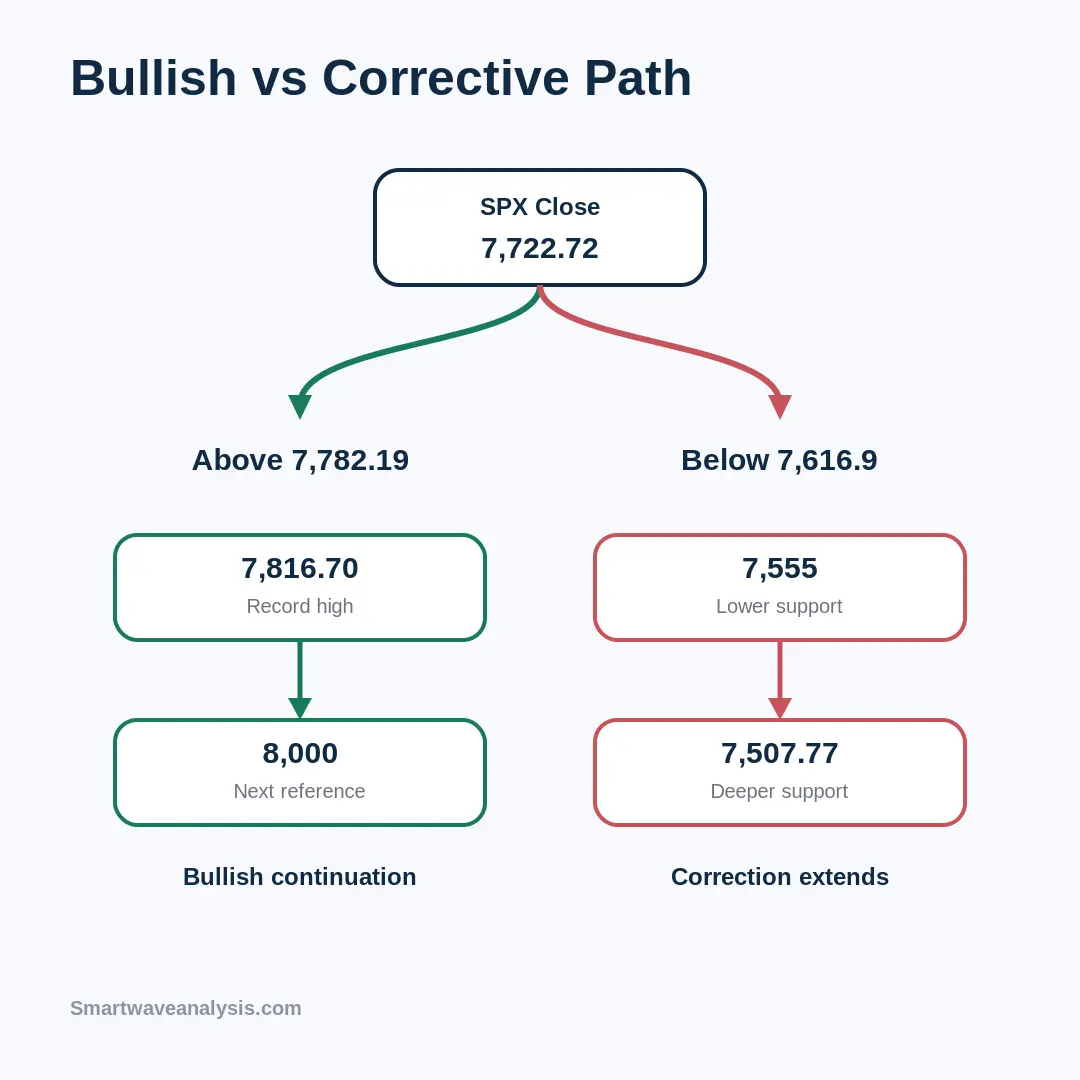
The recent premium Elliott Wave calculation produced a broad Equal Legs area from 7,362.45 to 7,557.95. SPX turned higher without reaching the bottom of that zone.
The reaction matters more than the label itself. A projected Fibonacci zone becomes useful only when price responds there and the following structure supports the count.
Fibonacci Retracement and Extension Levels
Fibonacci measurements should be used alongside swing structure rather than as isolated signals.
Common Elliott Wave relationships include 38.2%, 50%, 61.8%, 100%, and 161.8%. Previous SPX Elliott Wave research has also used overlapping Fibonacci extensions to define higher degree target areas.
For the current market, the most useful confluence comes from Fibonacci projections meeting visible price support or resistance.
Does Technical Analysis Confirm the Elliott Wave Count?
Market Breadth
Breadth sends a mixed message.
On October 2, advancing stocks outnumbered declining stocks on both the NYSE and Nasdaq as the market rallied.
The broader picture has been weaker. Recent market data showed a large gap between the capitalization weighted S&P 500 and its equal weighted counterpart, alongside weakness in the advance decline line and a large number of stocks trading below major moving averages.
That divergence does not invalidate the bullish Elliott Wave count, but it argues against treating a new SPX high as sufficient confirmation on its own.
Price and Trend
SPX remains close to its record high and above the 7,640 area identified near the 50 day moving average in late September. That keeps the near term trend constructive.
A break beneath that support cluster would weaken the technical backdrop before the deeper Elliott Wave levels are tested.
Volume and Volatility
Price confirmation should carry more weight than a single volatility reading. Current conditions include strong headline index performance alongside uneven participation beneath the surface.
That makes follow through above resistance more useful than assuming the correction is finished simply because SPX bounced.
SPX Levels That Would Change the Outlook
Confirmation Level
A break above 7,782.19 would strengthen the bullish count.
A move through 7,816.70 would confirm a new record high.
Warning Level
Loss of the 7,645 to 7,640 support area would warn that the October rebound is losing strength.
Invalidation Level
A break below 7,616.9 invalidates the short term view that the latest correction ended at that low.
Further weakness through 7,555 and 7,507.77 would strengthen the alternate corrective count.
What Comes Next for the S&P 500?
SPX enters the next session between clearly defined support and resistance.
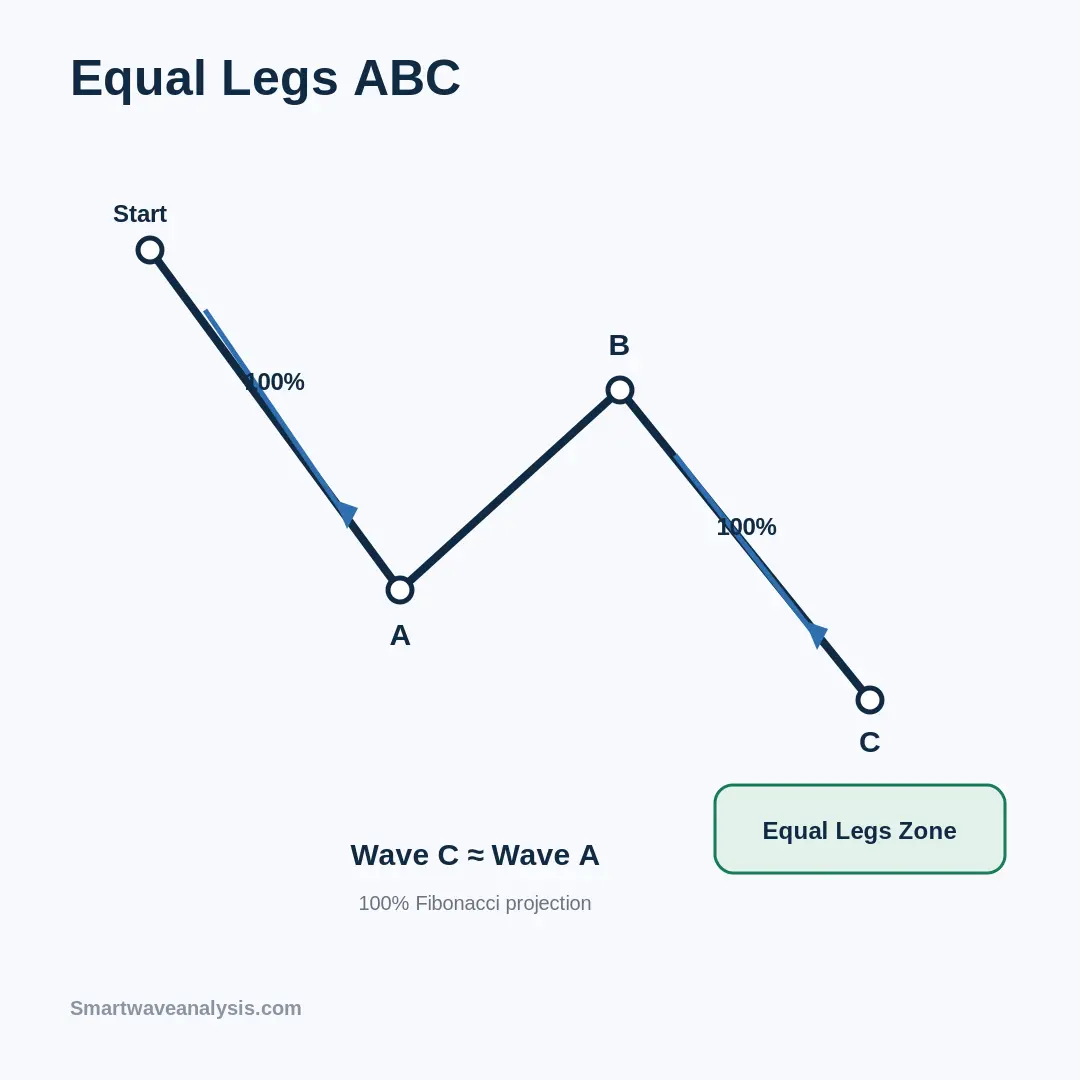
Above 7,616.9, the preferred Elliott Wave count allows another test of 7,782.19 and 7,816.70. A confirmed breakout above the record high would bring 8,000 into view.
Below 7,616.9, the current short term count fails. The focus would then shift toward 7,555 and 7,507.77 to determine whether SPX is forming a larger correction.
The index closed October 2 at 7,722.72, so neither the bullish breakout nor the bearish breakdown has been confirmed.
FAQS
What is the current SPX Elliott Wave count?
The preferred short term count treats the recent decline as a completed three wave correction while SPX remains above 7,616.9. A break below that low would require the count to be reassessed.
Is the S&P 500 Elliott Wave count bullish or bearish?
The near term count is bullish above 7,616.9, but SPX still needs to clear resistance at 7,782.19 and 7,816.70 to confirm renewed strength.
What are the next SPX Elliott Wave targets?
The nearest upside levels are 7,782.19 and the record high at 7,816.70. If SPX breaks above the record and holds, 8,000 becomes the next major reference.
What level invalidates the current SPX Elliott Wave count?
For the short term interpretation in this analysis, 7,616.9 is the invalidation level. Below it, the latest pullback can no longer be treated as complete under this count.
What does Equal Legs mean in Elliott Wave analysis?
Equal Legs refers to a measured move in which two parts of a correction have similar price length. Analysts often use a Fibonacci projection of the first leg from the end of the countertrend leg to estimate where the correction may finish.
Free Elliott Wave e-books
 FREE
Elliott Wave Forecasting Guide
A clear introduction to forecasting markets with the Elliott Wave Principle.
Get the free e-book FREE
Elliott Wave Trading Strategies
Practical setups for entries, stops and exits using wave structure.
Get the free e-book FREE
Beginner's Guide to Forex Trading
Forex basics for new traders: pairs, pips, lots, sessions and risk.
Get the free e-book FREE
Guide to Trading Stocks and ETFs
How stock and ETF markets work and how to read them with wave analysis.
Get the free e-bookFree download after a short sign-up with the publisher.
Educational content only. Nothing on this page is financial advice or a recommendation to buy or sell. Trading involves risk and you can lose money. Elliott Wave counts are probabilities, not certainties. Read our full disclaimer and affiliate disclosure.