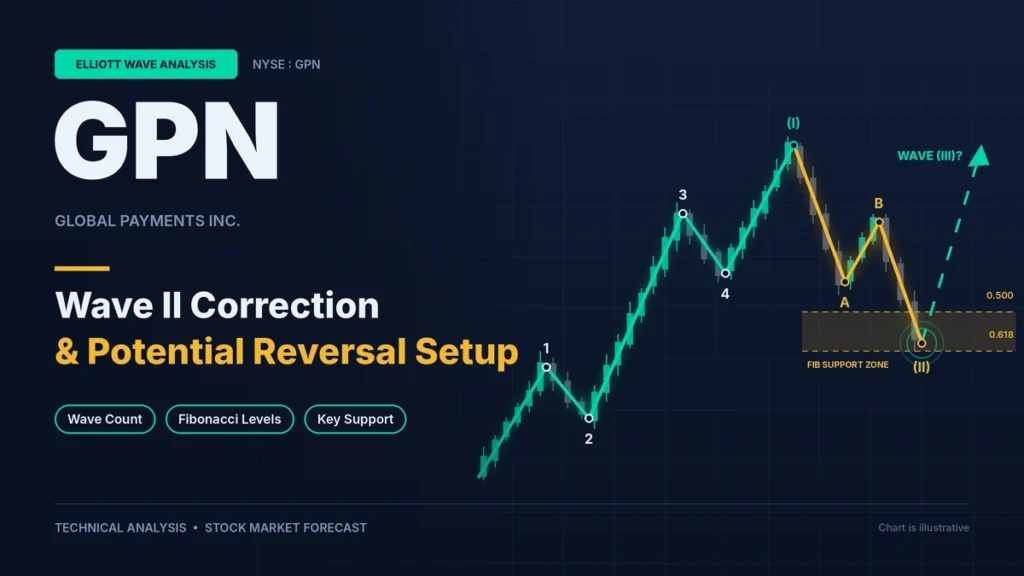
Global Payments Inc. (GPN) Overview
Global Payments Inc. (NYSE: GPN) is a payments technology company that provides merchant payment solutions, software, and commerce enablement services. The company operates across areas such as point-of-sale systems, integrated payments, embedded payment solutions, and core payment processing. According to its annual filing, Global Payments describes its business as providing technology and services that help businesses operate across multiple commerce channels worldwide.
For Elliott Wave traders, GPN is an interesting case because the stock has declined for an extended period after a major advance, creating a structure many technical analysts interpret as a corrective cycle. The current technical question is whether the decline represents a completed or late-stage Wave II correction before a new impulsive move higher.
Global Payments trades under the ticker GPN on the New York Stock Exchange.
Understanding the Current Elliott Wave Structure
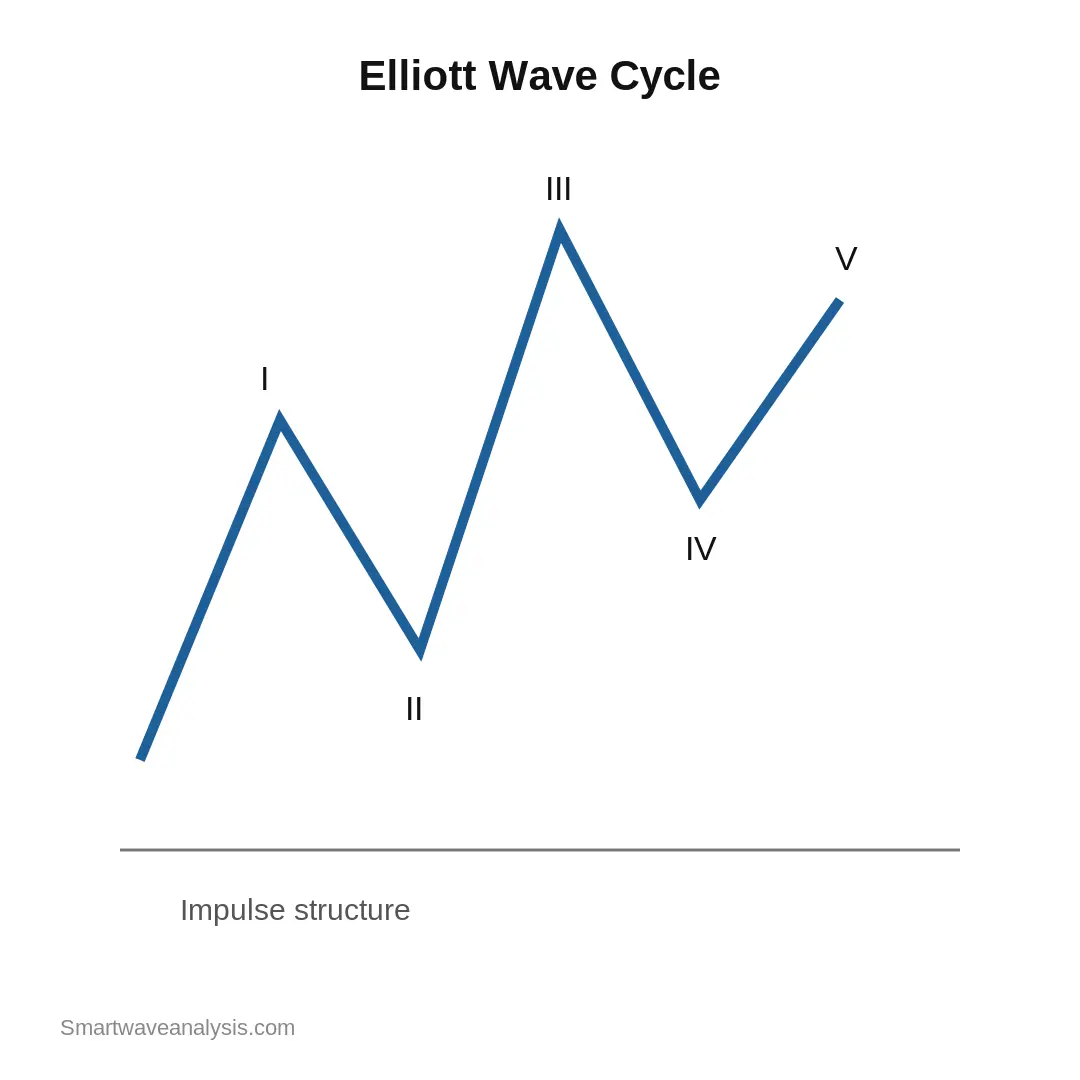
Elliott Wave analysis is based on the idea that financial markets move through repeating patterns of investor psychology. Ralph Nelson Elliott introduced the Elliott Wave Principle, which separates market movement into two broad categories:
- Impulse waves that move with the main trend
- Corrective waves that move against the previous trend
A typical impulse structure contains five waves:
- Wave I
- Wave II
- Wave III
- Wave IV
- Wave V
A corrective structure usually develops through three waves:
- Wave A
- Wave B
- Wave C
The key area of interest for GPN is the development of a possible Wave II correction after a prior bullish cycle.
What Is a Wave II Correction?
Wave II is the first major correction after Wave I.
Its purpose is to retrace part of the previous advance while correcting excessive optimism from the initial move. Wave II corrections are often deep and can create uncertainty because they may appear like a complete trend reversal.
Common Wave II characteristics include:
• Deep retracements
• Complex corrective patterns
• Strong emotional selling
• Fibonacci retracement relationships
• False breakdowns before a new trend begins
A Wave II correction cannot move beyond the beginning of Wave I. That point becomes the key invalidation level for the bullish Elliott Wave interpretation.
🚀 Don’t Miss the Next Move
Get daily Elliott Wave counts, live chart updates, and high-probability trade setups across crypto, forex, and stocks — before the market moves.
👉 Start Your 14-Day Trial for Just $0.99 →Cancel anytime. No long-term commitment. (Affiliate link — we may earn a commission at no extra cost to you.)
Elliott Wave Rules for Wave II Retracements
A valid Wave II structure generally follows these principles:
• It cannot retrace beyond the start of Wave I
• It often retraces a large portion of Wave I
• It frequently develops as a zigzag or complex correction
• Momentum often weakens near completion
These rules allow traders to separate a normal correction from a damaged long-term trend.
Global Payments Elliott Wave Count Analysis
The primary technical question is whether GPN is forming a corrective Wave II structure after completing an earlier bullish advance.
Many Elliott Wave analysts describe the current structure as a complex correction involving a W-X-Y pattern. A W-X-Y correction consists of:
• Wave W: first corrective structure
• Wave X: connecting correction
• Wave Y: final corrective structure
This pattern is common when a market requires more time to complete a larger correction.
Previous Wave I Impulse Structure
The first step in analyzing a Wave II correction is identifying the completed Wave I advance.
A bullish Wave I normally contains:
• Five smaller internal waves
• Increasing investor participation
• A clear trend structure
• Strong directional movement
Once Wave I completes, the market often enters a corrective phase as traders take profits and sentiment resets.
For GPN, the Wave II interpretation focuses on whether the decline from the previous peak has the characteristics of a correction rather than a new long-term bearish impulse.
Current Wave II Correction Development
The current Wave II analysis focuses on whether the decline has developed into a completed corrective structure.
A possible corrective sequence includes:
Wave A:
Initial decline from the previous high.
Wave B:
Temporary recovery that creates the appearance of a new bullish trend.
Wave C:
Final selling phase that completes the correction.
In more complex cases, the correction may extend into a W-X-Y pattern.
W-X-Y Corrective Pattern Breakdown
A W-X-Y correction differs from a simple A-B-C correction because it contains multiple corrective combinations.
Structure:
W → X → Y
The pattern often appears when the market needs additional time before establishing the next directional move.
For GPN traders, identifying whether the final Y wave has completed is important because a completed Wave II correction could create the foundation for a larger Wave III advance.
Fibonacci Analysis and Key Support Zones
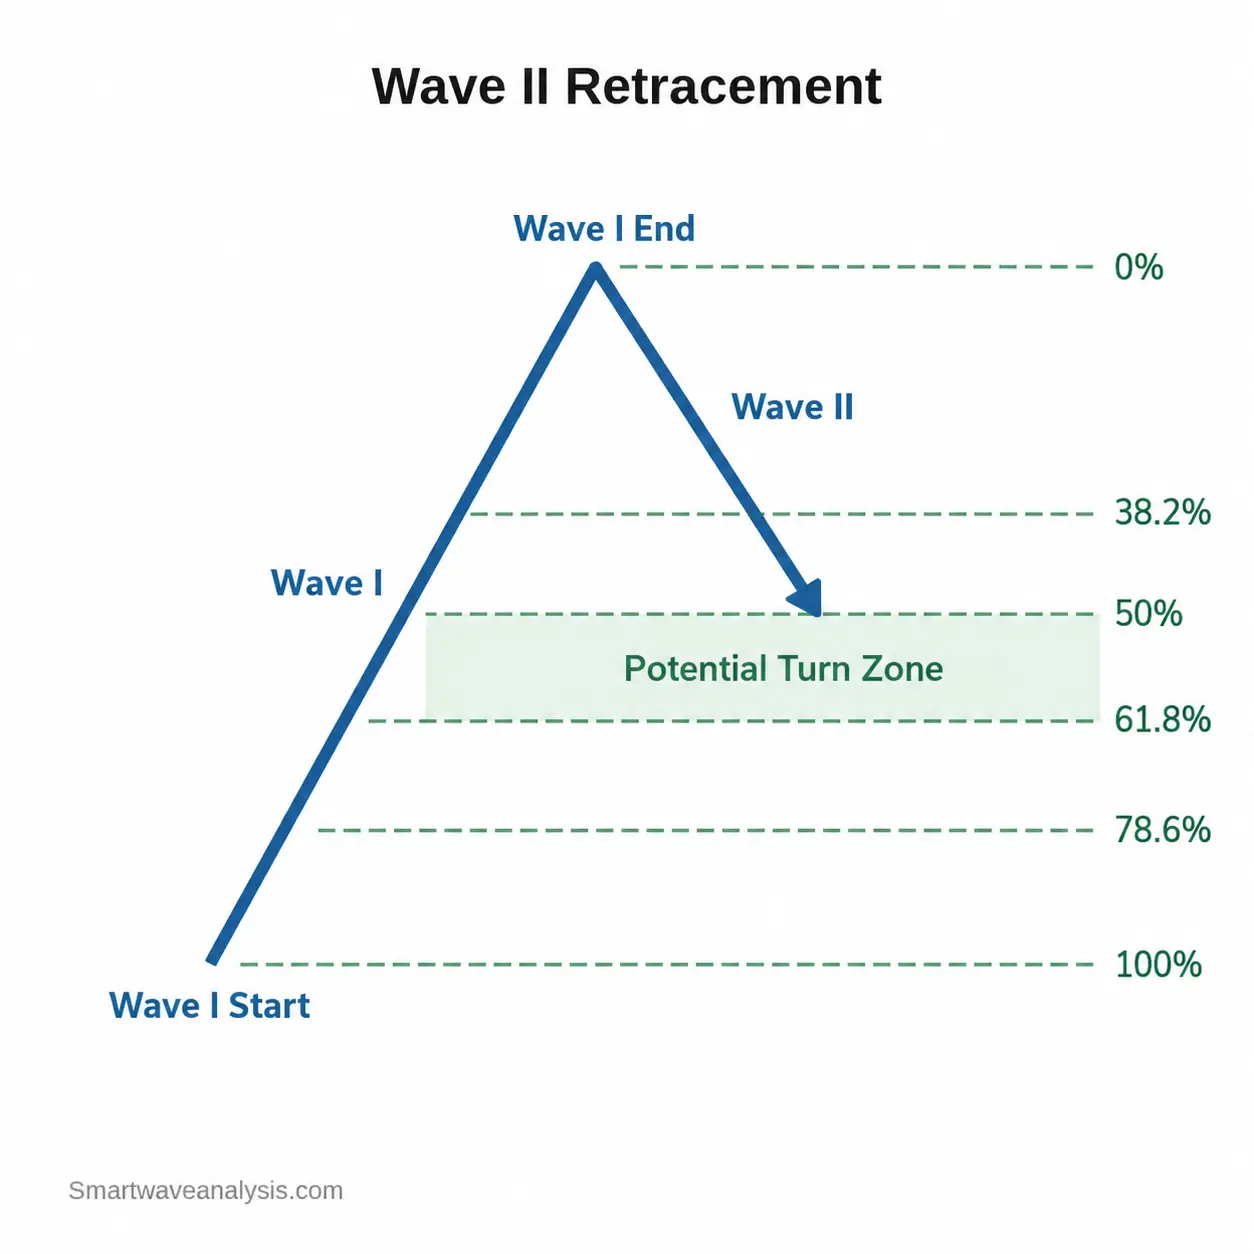
Fibonacci analysis is frequently used alongside Elliott Wave theory because many corrective waves terminate near Fibonacci retracement levels.
Common Fibonacci areas monitored by Elliott Wave traders include:
• 38.2% retracement
• 50% retracement
• 61.8% retracement
• 78.6% retracement
The most important factor is not a single Fibonacci number but the relationship between:
• Wave structure
• Fibonacci levels
• Price reaction
• Momentum confirmation
A potential Wave II completion is stronger when several technical factors align.
Fibonacci Retracement Levels
During a Wave II correction, traders commonly measure the decline from the Wave I low to the Wave I high.
Deep retracement areas can become important observation zones.
However, Fibonacci levels should be treated as potential areas of interest rather than guaranteed turning points.
Fibonacci Extension Targets
If a Wave II correction completes, Elliott Wave traders often project future Wave III targets using Fibonacci extensions.
Common measurement methods include:
• Wave I length projection
• Wave III extension calculations
• Previous resistance zones
Important GPN Support and Resistance Levels
Key technical levels to monitor include:
Support:
• Previous swing lows
• Fibonacci retracement areas
• Wave II completion zones
Resistance:
• Previous corrective highs
• Breakdown points
• Prior supply areas
A sustained move above resistance can provide additional evidence that a correction may be complete.
Bullish Elliott Wave Scenario for GPN
The bullish Elliott Wave scenario assumes that the Wave II correction has either completed or is approaching completion.
Supporting factors may include:
• Completion of a W-X-Y correction
• Price stabilization near support zones
• A break above corrective resistance
• Improving momentum conditions
• Development of a new impulsive structure
If Wave II completes, the next major Elliott Wave phase would typically be Wave III.
Wave III is often considered the strongest wave in an Elliott Wave sequence because it usually develops with increasing market participation.
Conditions That Support Wave II Completion
Traders may monitor:
• Higher highs and higher lows
• Breakout from corrective channels
• Increasing volume during advances
• Positive momentum divergence
No single indicator confirms a wave count. The structure must continue to validate itself through price movement.
Bearish Alternative Elliott Wave Scenario
A responsible Elliott Wave analysis should also consider invalidation.
The bearish alternative suggests that:
• The correction may not be complete
• The market could require additional downside movement
• The current structure may develop into a larger corrective pattern
Signs that would weaken the bullish interpretation include:
• Breakdown below important support
• Failure to reclaim resistance
• Development of additional corrective subdivisions
The invalidation point is a critical part of Elliott Wave analysis because it defines when the original wave interpretation is no longer valid.
GPN Technical Analysis Beyond Elliott Wave
Elliott Wave analysis becomes stronger when combined with traditional technical tools.
Momentum Indicators
Indicators such as RSI and MACD can help evaluate:
• Momentum strength
• Divergence patterns
• Potential trend changes
They do not predict future prices but can provide additional context.
Volume Analysis
Volume can help evaluate whether price movement has strong participation.
Important observations include:
• Rising volume during advances
• Weak volume during declines
• Breakout confirmation
Trend Structure
Technical analysts often examine:
• Higher highs
• Higher lows
• Moving averages
• Trend channels
These tools help determine whether a market is transitioning from correction into a new trend phase.
Global Payments and the Payments Industry Context
Global Payments operates within the broader financial technology and digital payments industry.
The company’s business includes merchant solutions such as point-of-sale technology, integrated payments, and embedded payment solutions.
The payments industry has continued to evolve through:
• Digital commerce growth
• Embedded payments
• Software integration
• Contactless payment adoption
Global Payments has also undergone significant strategic changes, including its acquisition of Worldpay and divestiture of its Issuer Solutions business, reshaping its operating structure around merchant solutions.
These business developments provide fundamental context, while Elliott Wave analysis focuses specifically on market price structure.
Frequently Asked Questions
What is the current Elliott Wave count for Global Payments (GPN)?
The current Elliott Wave interpretation focuses on whether GPN has completed a Wave II correction, potentially forming a W-X-Y corrective structure. Traders should monitor price action and invalidation levels because wave counts can change as new market data develops.
Is Global Payments stock completing a Wave II correction?
A possible Wave II completion depends on confirmation from price structure, resistance breaks, and momentum behavior. Elliott Wave analysis identifies potential scenarios rather than guaranteed outcomes.
What is a W-X-Y Elliott Wave correction?
A W-X-Y correction is a complex corrective pattern consisting of two corrective structures connected by an intervening wave. It often appears when a market correction extends beyond a simple A-B-C pattern.
What Fibonacci levels are important for GPN?
Elliott Wave traders commonly monitor Fibonacci retracement levels such as 38.2%, 50%, 61.8%, and 78.6% when evaluating possible correction zones.
What invalidates a bullish Elliott Wave scenario for GPN?
A bullish wave interpretation becomes invalid if price breaks below the level where the proposed Wave I structure began or if the market develops a structure inconsistent with Elliott Wave rules.
Free Elliott Wave e-books
 FREE
Elliott Wave Forecasting Guide
A clear introduction to forecasting markets with the Elliott Wave Principle.
Get the free e-book FREE
Elliott Wave Trading Strategies
Practical setups for entries, stops and exits using wave structure.
Get the free e-book FREE
Beginner's Guide to Forex Trading
Forex basics for new traders: pairs, pips, lots, sessions and risk.
Get the free e-book FREE
Guide to Trading Stocks and ETFs
How stock and ETF markets work and how to read them with wave analysis.
Get the free e-bookFree download after a short sign-up with the publisher.
Educational content only. Nothing on this page is financial advice or a recommendation to buy or sell. Trading involves risk and you can lose money. Elliott Wave counts are probabilities, not certainties. Read our full disclaimer and affiliate disclosure.