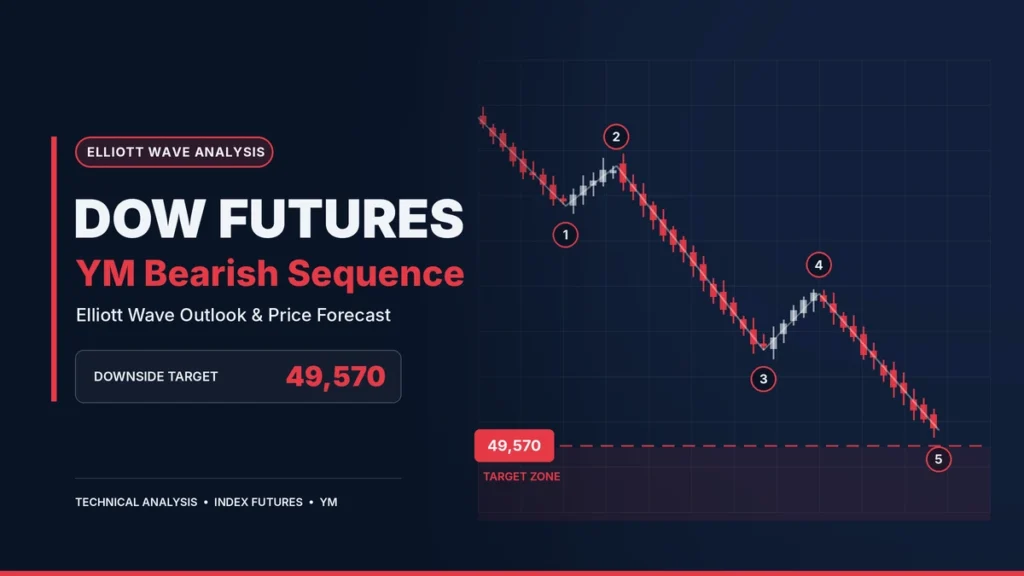
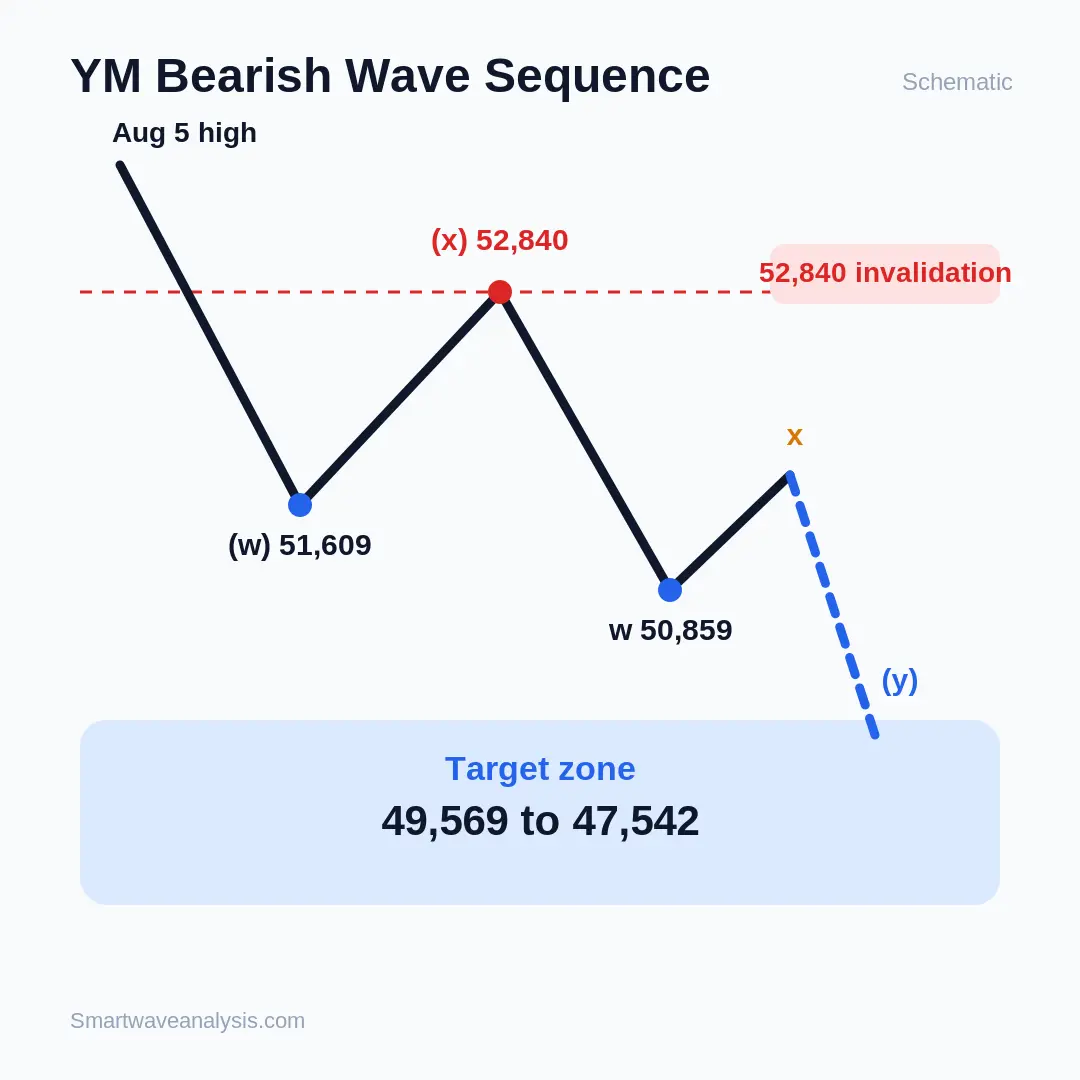
Dow Jones futures remain in a short term bearish Elliott Wave sequence from the August 5, 2026 high. The current count places wave (w) at 51,609 and wave (x) at 52,840. Price later moved below the 51,609 low, supporting the view that wave (y) is in progress. The projected Fibonacci area for this decline spans 49,569 to 47,542.
The bearish interpretation remains tied to 52,840. As long as YM remains below that level, the existing short term W X Y count remains valid. A move above 52,840 would invalidate this specific interpretation and require a fresh wave count.
Dow Jones Futures Elliott Wave Outlook at a Glance
The current YM structure can be summarized through four price levels.
| YM level | Elliott Wave significance |
|---|---|
| 52,840 | Wave (x) high and invalidation point for the current short term bearish count |
| 51,609 | End of wave (w) |
| 50,859 | End of lower degree wave w inside wave (y) |
| 49,569 to 47,542 | Projected 100 percent to 161.8 percent Fibonacci extension area |
Why the YM Elliott Wave Count Remains Bearish
Wave (W) Decline From the August 5 High
The short term count starts at the August 5, 2026 high. The first decline completed wave (w) at 51,609.
In Elliott Wave analysis, a corrective move can develop through several connected patterns rather than a single ABC decline. Elliott Wave International describes combinations as corrective structures made from simpler patterns such as zigzags, flats, and triangles. In a two part combination, the main components are labeled W and Y, with an intervening X wave.
Wave (X) Rally to 52,840
After wave (w) reached 51,609, YM rallied to 52,840 in wave (x).
Wave X is treated as a corrective connector rather than the start of the next main trend within a W X Y structure. Elliott Wave International notes that X waves link the corrective components of double structures.
That makes 52,840 the reference point for the present count.
Break Below 51,609 Supports Wave (Y)
YM subsequently moved below the 51,609 termination of wave (w). Under the published count, that price action supports the interpretation that wave (y) has started rather than the correction ending at 51,609.
Inside wave (y), the first lower degree wave w ended at 50,859. The following wave x is treated as a corrective rebound from the decline that began at the September 22 high.
YM Downside Target: 49,569 to 47,542
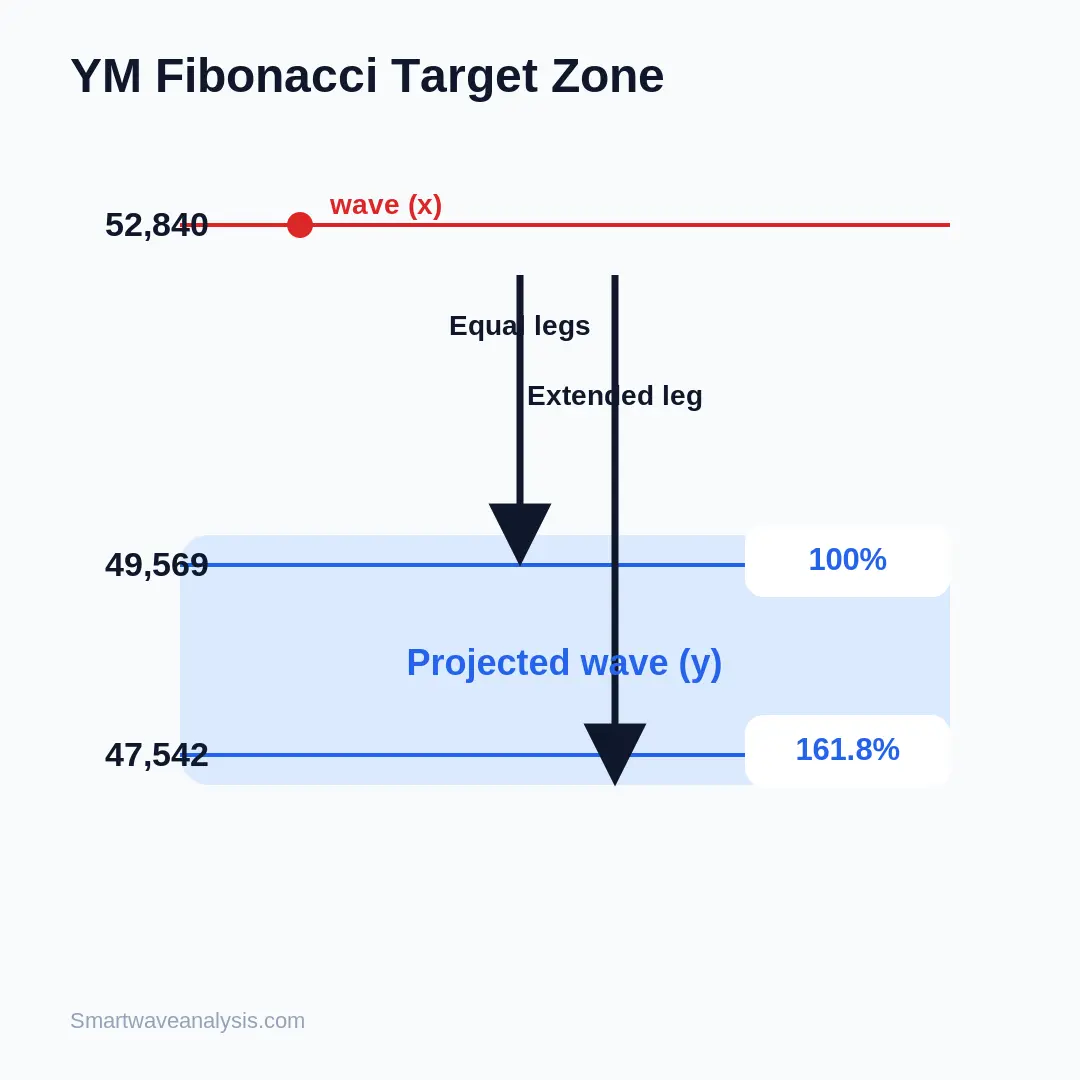
The published target for wave (y) is the 100 percent to 161.8 percent Fibonacci extension of wave (w), projected from wave (x) at 52,840. That produces the 49,569 to 47,542 target area.
100 Percent Fibonacci Extension
The 100 percent projection looks for wave (y) to travel approximately the same distance as wave (w).
Using the published upper target:
52,840 minus approximately 3,271 points equals 49,569.
This is the equal legs concept commonly used when comparing related corrective waves.
A test of 49,569 would therefore satisfy the approximate 100 percent relationship between the two declining legs.
161.8 Percent Fibonacci Extension
A larger wave (y) can extend beyond equal legs. The next projection used in the published analysis is 161.8 percent, producing the lower portion of the target near 47,542.
The entire 49,569 to 47,542 area should be treated as a projection zone rather than a precise reversal price. Elliott Wave patterns can change as new price data develops.
🚀 Don’t Miss the Next Move
Get daily Elliott Wave counts, live chart updates, and high-probability trade setups across crypto, forex, and stocks — before the market moves.
👉 Start Your 14-Day Trial for Just $0.99 →Cancel anytime. No long-term commitment. (Affiliate link — we may earn a commission at no extra cost to you.)
What the W X Y Double Three Means
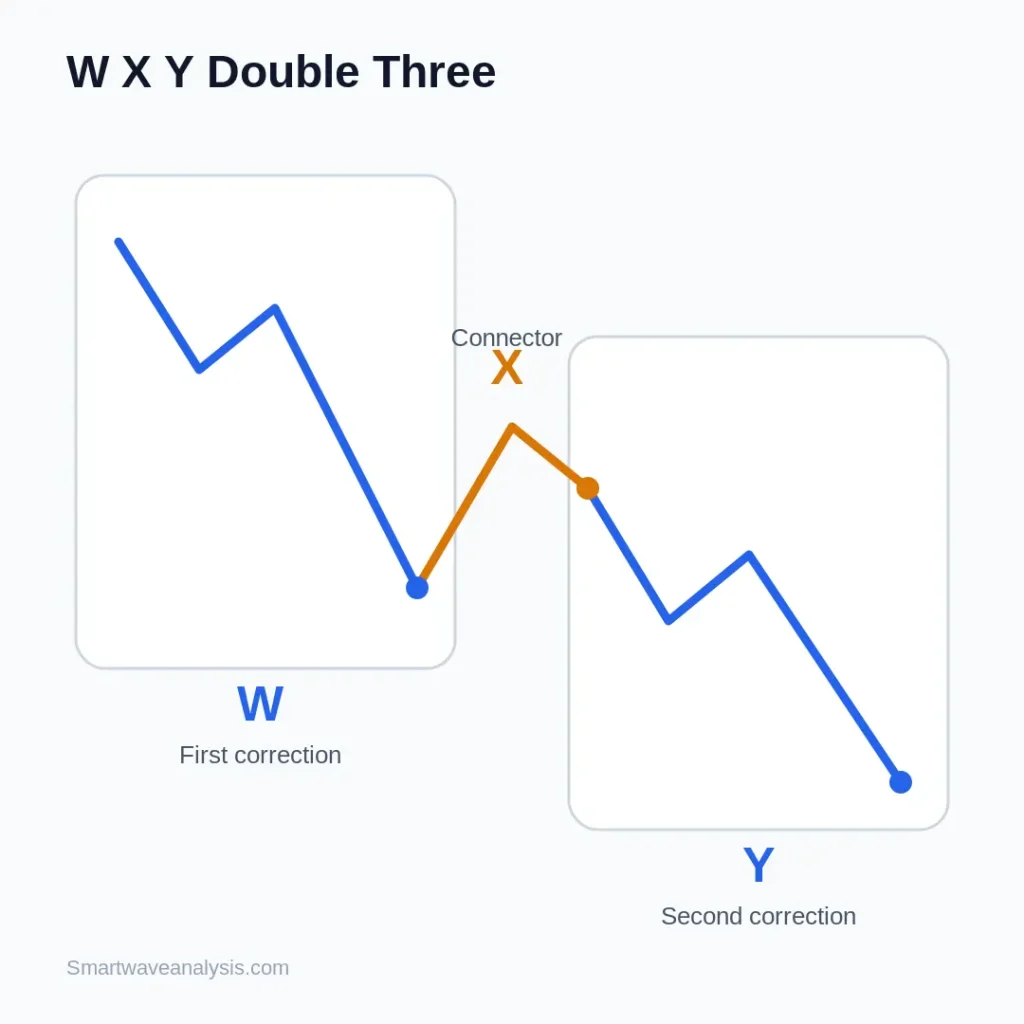
A double three is a corrective combination consisting of two corrective patterns connected by an X wave.
Elliott Wave International describes the two main components as W and Y. Each can contain simpler corrective structures, while X acts as the intervening correction. Combinations often use zigzags, flats, or triangles.
W, X and Y Explained
W is the first corrective structure.
X is the connecting correction.
Y is the second corrective structure.
This notation identifies a correction that requires more than one simple pattern to complete.
Double Three vs Simple ABC Correction
A basic zigzag uses an A B C structure and subdivides 5 3 5. Elliott Wave International distinguishes this from combinations, where separate corrective structures are linked using W X Y notation.
That distinction matters in YM because the current interpretation does not treat the decline as one simple ABC pattern.
Lower Degree W X Y Inside Wave (Y)
The current YM count also places another W X Y structure inside the larger wave (y).
This is an example of wave degree. A larger corrective wave can contain smaller corrective patterns without changing the label of the larger structure.
The published count places the first lower degree wave w at 50,859, followed by a corrective wave x.
YM Support, Resistance and Invalidation Levels
52,840 Bearish Invalidation Level
The clearest level in the current count is 52,840.
Below 52,840, the existing bearish W X Y interpretation remains intact.
A sustained move above 52,840 would invalidate the stated short term count because price would exceed the wave (x) high used to define the current sequence.
That would not automatically prove that YM has entered a new long term bull leg. It would mean the current short term labeling needs to be rebuilt from the latest price structure.
Near Term Resistance During Wave X
The present lower degree wave x is expected to correct part of the decline from the September 22 high. Under the published scenario, that rebound should remain below 52,840.
Any rally that remains beneath that pivot can still fit within the bearish corrective structure.
Downside Support Inside the Fibonacci Zone
The first projected area starts near 49,569.
If YM continues lower through that level, the Fibonacci projection extends toward 47,542.
Neither level guarantees a reversal. Traders should watch the internal wave structure as price enters the zone rather than assuming the first touch will end wave (y).
Primary and Alternate Elliott Wave Counts
Primary Count: Wave Y Extends Lower
The primary count favors continuation of wave (y) toward 49,569 to 47,542 while price remains below 52,840.
That interpretation is supported by the move beneath the prior wave (w) low at 51,609 and the lower degree decline to 50,859.
Alternate Count: What Changes Above 52,840?
A break above 52,840 would remove the main reference point holding the current bearish structure together.
At that stage, the correct response is not to force the existing labels onto new price action. The wave count should be reassessed using the new swing structure.
An alternate count should only be labeled once sufficient price structure exists to support it.
Multi Timeframe Dow Futures Analysis
Daily Elliott Wave Structure
The current forecast is a short term correction measured from the August 5 high. It should not be interpreted by itself as proof of a long term bear market.
The daily chart is better used to determine where the August correction sits within the larger Dow trend.
4 Hour YM Structure
On the 4 hour chart, 52,840 remains the main structural reference.
Holding below that price keeps the present decline and its Fibonacci projections relevant. A break above it requires reassessment.
60 Minute YM Elliott Wave Chart
The 60 minute chart provides the most detail for the published count.
It tracks wave (w) at 51,609, wave (x) at 52,840, and the lower degree wave w at 50,859 inside wave (y). Several analysts use the 60 minute chart for this October 2 setup.
What Would Confirm the Next Move in YM?
Bearish Confirmation
Further downside would support the primary count if YM completes the lower degree corrective rebound below 52,840 and then breaks the next established swing low.
A sequence of lower highs and lower lows would also remain consistent with the existing short term structure.
Bearish Count Failure
The clearest failure condition is a move above 52,840.
That level marks the wave (x) high in the current analysis. Trading above it would invalidate the present short term W X Y interpretation.
How YM Relates to the Dow Jones Industrial Average
YM is the ticker symbol for E mini Dow 5 dollar Futures.
According to CME Group contract specifications, one YM contract represents 5 dollars multiplied by the Dow Jones Industrial Average, and one index point equals 5 dollars per contract. CME lists the contract as cash settled and tied to the DJIA.
This makes YM a futures instrument for gaining exposure to movements in the Dow Jones Industrial Average rather than a share of the index itself.
FAQS
Is the Elliott Wave outlook for Dow futures bearish?
The current short term YM count is bearish below 52,840. The published structure places wave (y) in progress with a projected Fibonacci target at 49,569 to 47,542.
What is the current YM downside target?
The present Elliott Wave projection is 49,569 to 47,542. It represents the 100 percent to 161.8 percent Fibonacci extension of wave (w) measured from the wave (x) high.
What price invalidates the bearish YM wave count?
The current short term bearish count is invalidated above 52,840, the published wave (x) high.
What does W X Y mean in Elliott Wave analysis?
W X Y identifies a corrective combination. W is the first corrective structure, X connects the two structures, and Y is the second correction.
What is a double three Elliott Wave correction?
A double three combines two corrective patterns through an intervening X wave. The individual structures can include zigzags, flats, or triangles.
What is the YM futures symbol?
YM is the CME ticker symbol for E mini Dow 5 dollar Futures. The contract tracks the Dow Jones Industrial Average using a 5 dollar multiplier per index point.
Free Elliott Wave e-books
 FREE
Elliott Wave Forecasting Guide
A clear introduction to forecasting markets with the Elliott Wave Principle.
Get the free e-book FREE
Elliott Wave Trading Strategies
Practical setups for entries, stops and exits using wave structure.
Get the free e-book FREE
Beginner's Guide to Forex Trading
Forex basics for new traders: pairs, pips, lots, sessions and risk.
Get the free e-book FREE
Guide to Trading Stocks and ETFs
How stock and ETF markets work and how to read them with wave analysis.
Get the free e-bookFree download after a short sign-up with the publisher.
Educational content only. Nothing on this page is financial advice or a recommendation to buy or sell. Trading involves risk and you can lose money. Elliott Wave counts are probabilities, not certainties. Read our full disclaimer and affiliate disclosure.