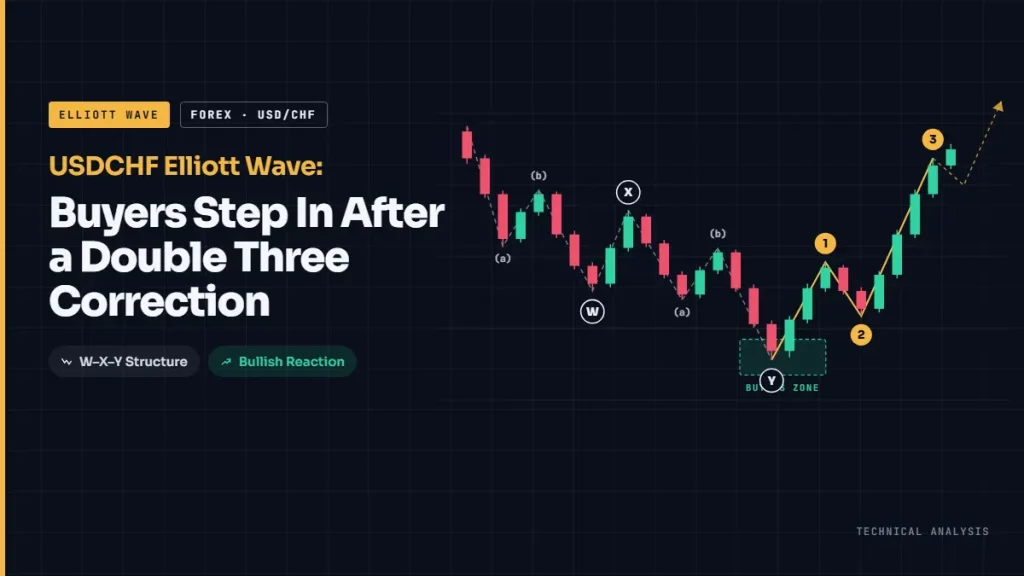
USDCHF found buyers inside the 0.8240 to 0.8219 equal legs zone and ended a seven-swing double three correction at 0.82267. That low completes wave (iv) of the rally from the August 20, 2026 low at 0.7953. While price holds above 0.82267, the Elliott Wave count favors a wave (v) advance to a new high above the October 1 peak.
USDCHF Elliott Wave Outlook at a Glance
The bullish view holds while price stays above 0.82267. The table lists every level that matters for the next move.
| Level | Price | What it means |
|---|---|---|
| Cycle low | 0.7953 | Start of the bullish cycle (August 20, 2026) |
| Wave ((iii)) high | about 0.8353 | October 1 peak, highest since mid-May 2025 |
| Equal legs zone | 0.8240 to 0.8219 | 100% to 123.6% projection of wave (w) from wave (x) |
| Wave ((iv)) low | 0.82267 | Double three complete and bullish invalidation |
| Support below | 0.8208 to 0.8194 | July 2026 high and September 22 low |
| Wave ((v)) targets | 0.8380, then 0.8474 | Fibonacci extensions of the cycle |
| Bias | Bullish above 0.82267 | 1-hour and 4-hour charts |
The Bigger Picture: Where This Correction Fits
The Cycle from the 0.7953 Low
USDCHF set its 2026 low near 0.7604 in late January and rallied to 0.8208 in late July. It then fell to 0.7953 on August 20, after a US Treasury debt buyback announcement pushed yields and the dollar lower. From that low, the pair gained about 4.5% into October 1, according to ECB reference rates compiled by.
The break above the July high came on September 16, the day the Federal Reserve raised rates. A higher low in August followed by a higher high in September is the bullish swing sequence that Elliott Wave traders want before buying pullbacks.
Daily and 4-Hour Wave Count
On the 4-hour chart, the advance from 0.7953 counts as an impulse in progress. Waves ((i)), ((ii)) and ((iii)) are complete at the October 1 high, and wave ((iv)) is the pullback that just ended.
One detail strengthens this count. The equal legs zone sits directly above the old July high at 0.8208. Former resistance turning into support is a separate confirmation, and here it lines up with a Fibonacci projection built by a different method.
[Chart: USDCHF 4-hour with waves ((i)) to ((iv)) labelled and the July high marked. Alt text: USDCHF 4-hour Elliott Wave count from the 0.7953 low with wave ((iv)) double three ending at 0.82267]
What Is an Elliott Wave Double Three?
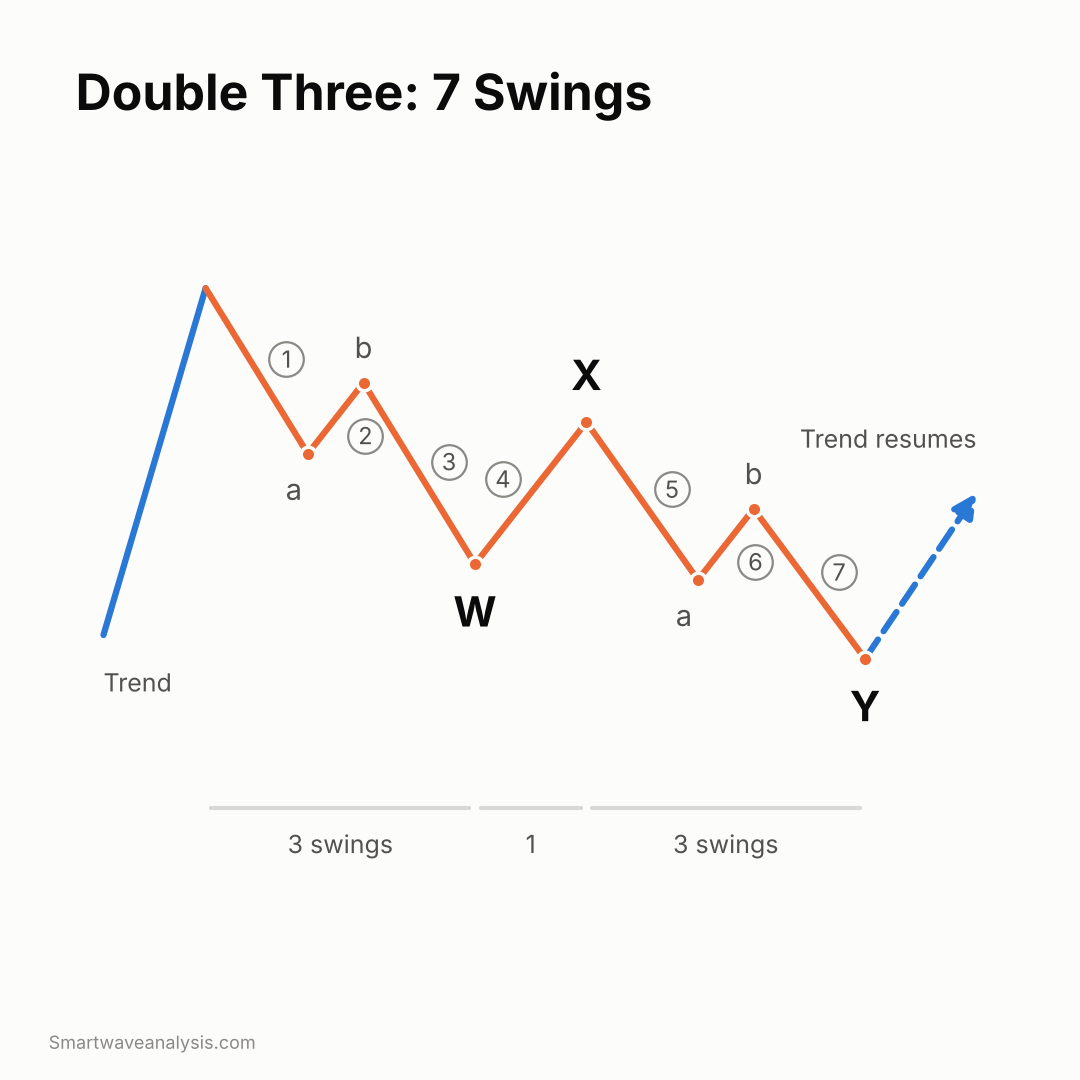
A double three is a corrective pattern built from two simple corrections, labelled W and Y, joined by a connecting wave labelled X. W and Y each show three swings, and X adds one connecting swing, so the pattern counts seven swings. All three legs are corrective, so the internal structure is written as 3-3-3.
The WXY Structure and 7-Swing Count
Wave W is a zigzag or a flat. Wave X moves against W in three waves. Wave Y is another simple correction and often travels the same distance as W. In Elliott Wave Principle, A.J. Frost and Robert Prechter describe these combinations as sideways corrections that add time when a single zigzag or flat ends too early.
Rules for a Valid Double Three
- W and Y are each simple corrections: a zigzag, a flat, or a triangle.
- A triangle, when present, appears only as the final leg.
- X can be any corrective pattern and is most often a zigzag.
- No leg should count as a standalone five-wave impulse.
- Y commonly ends at 100% of W, with 123.6% and 161.8% as the next projections.
The last guideline is the basis of the equal legs method used on USDCHF.
Double Three vs Double Zigzag vs Triple Three
| Pattern | Labels | Swings | Leg types | Typical shape |
|---|---|---|---|---|
| Double three | W, X, Y | 7 | Mix of zigzag, flat, triangle | Mostly sideways |
| Double zigzag | W, X, Y | 7 | Both legs are zigzags (5-3-5) | Steep, deepens the correction |
| Triple three | W, X, Y, X, Z | 11 | Three simple corrections | Long and sideways, rare |
🚀 Don’t Miss the Next Move
Get daily Elliott Wave counts, live chart updates, and high-probability trade setups across crypto, forex, and stocks — before the market moves.
👉 Start Your 14-Day Trial for Just $0.99 →Cancel anytime. No long-term commitment. (Affiliate link — we may earn a commission at no extra cost to you.)
How the USDCHF Double Three Unfolded on the 1-Hour Chart
Waves (w), (x) and (y) of Wave ((iv))
From the October 1 high, USDCHF fell in three swings to complete wave (w). It bounced in three swings for wave (x), then broke below the (w) low to start wave (y). Every leg overlapped, which marks a correction rather than a new downtrend.
The decline had a clear trigger. On October 2, the franc gained against the dollar, the euro and the pound at once, and USDCHF fell 1.0%, its largest daily drop since August 20. Commerzbank, quoted by the AWP news agency, tied the franc’s gain to a jump in government bond yields led by France (ibani).
How the 0.8240 to 0.8219 Equal Legs Zone Was Calculated
- Measure wave (w) from its start to its end.
- Project that length from the end of the wave (x) with the Fibonacci extension tool.
- The 100% projection gives 0.8240, and the 123.6% projection gives 0.8219.
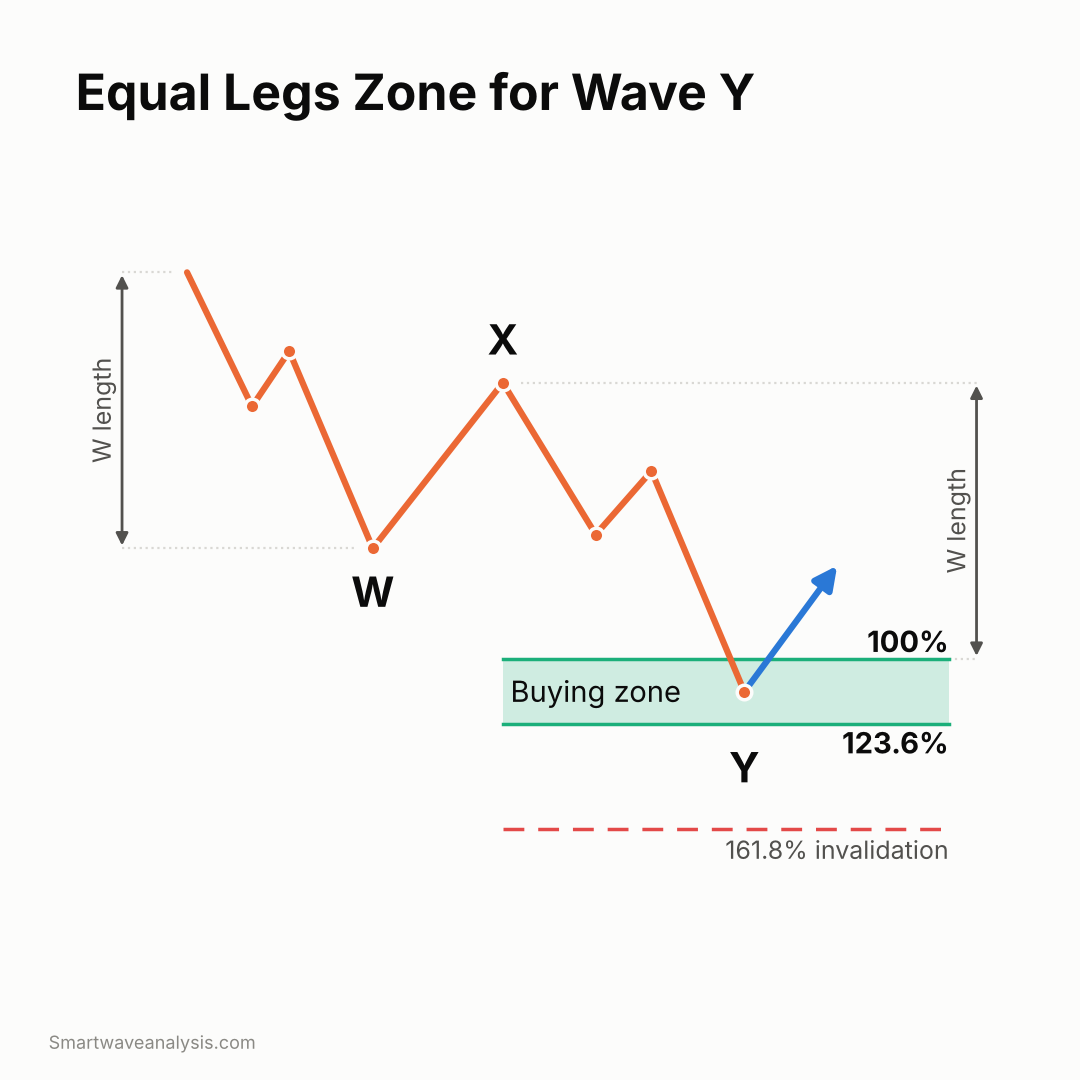
The 21-pip width of the zone equals 23.6% of wave (w), which puts wave (w) at about 89 pips. Wave (y) ended at 0.82267, roughly 115% of wave (w), inside the zone and above the July high.
The Reaction from 0.82267
Buyers stepped in at 0.82267, and the pair turned higher. To confirm wave (v), traders want two signals on the 1-hour chart: a five-wave rise from 0.82267 and a break above the wave (x) high. Until both appear, a three-wave bounce followed by another low remains possible.
[Chart: USDCHF 1-hour with (w), (x) and (y) labelled and the equal legs zone shaded. Alt text: USDCHF 1-hour double three WXY correction ending at 0.82267 inside the 0.8240 to 0.8219 equal legs zone]
USDCHF Forecast: Wave ((v)) Targets and Invalidation
Bullish Path and Fibonacci Extension Targets
Wave ((v)) usually makes a new high beyond wave ((iii)). A fifth wave that fails to do so is called a truncation and signals weakness. Using the October 1 reference high of 0.8353, waves ((i)) through ((iii)) covered about 400 pips. Projected from 0.82267:
- 0.382 extension: 0.8380
- 0.618 extension: 0.8474
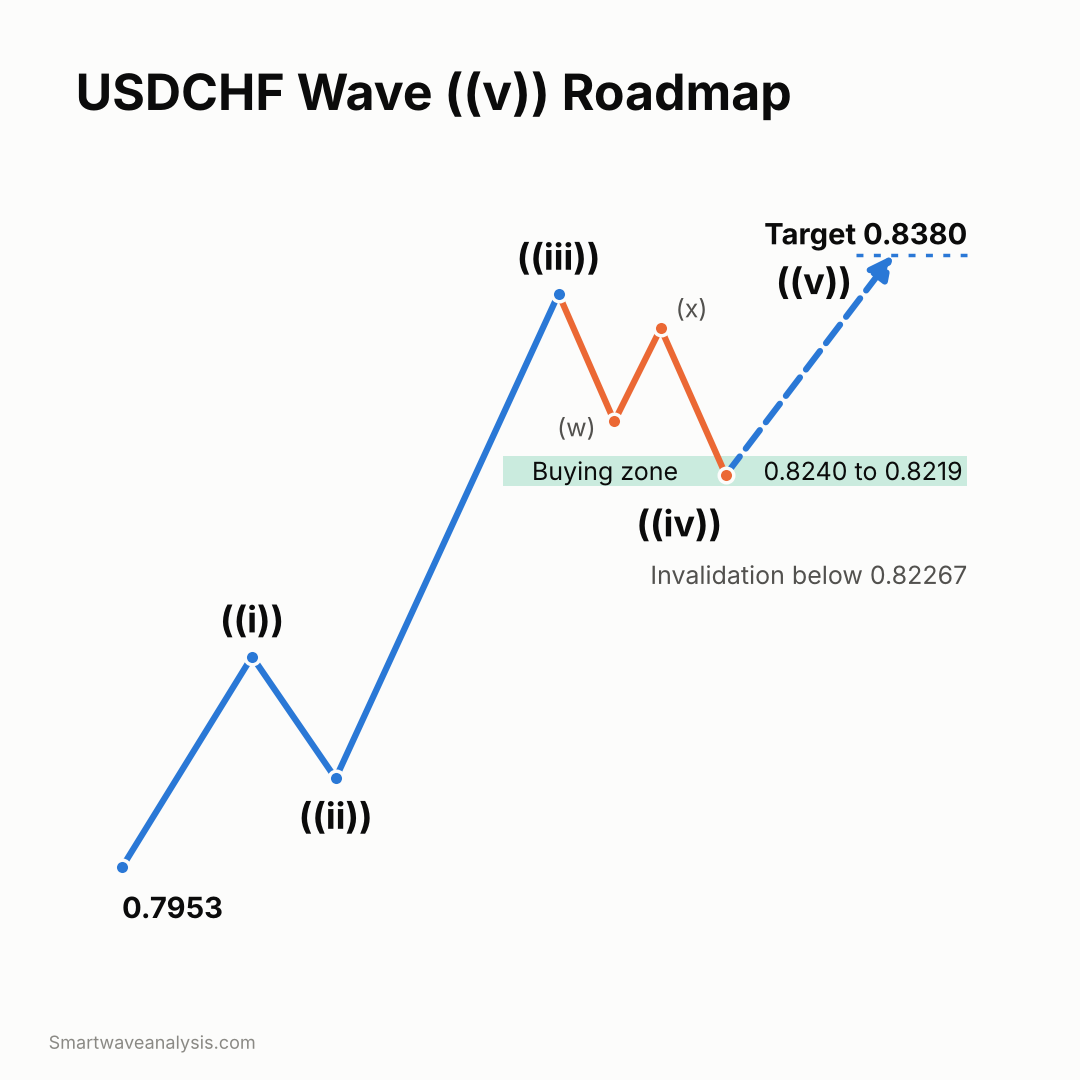
The round 0.8400 level sits between the two. If USDCHF holds above 0.82267 and clears 0.8353, 0.8380 is the first objective. Once wave ((v)) ends, the cycle from 0.7953 would show five waves up, and a larger three-wave pullback would follow.
What Invalidates the View: The Alternate Count
A break below 0.82267 means wave (iv) is not finished. The correction could then extend into a triple three (WXYXZ, 11 swings), with 0.8208 to 0.8194 as the next support. A deeper drop that overlaps the wave ((i)) high would break the impulse rule. That would turn the move from 0.7953 into a three-wave rally and shift the bias to neutral.
How to Trade the Setup: Entry, Stop and Management
The example below shows how the zone could have been traded. Price has already reacted, so new entries today would use different levels.
Entry and Stop-Loss Placement
A trader buying inside the zone with an average entry of 0.8230 would place the stop below the 161.8% projection of wave (w), near 0.8185. That level also sits under the September 22 low at 0.8194. A stop at 0.8180 gives 50 pips of risk.
When to Move the Stop to Break-Even
Once the bounce retraces 50% of wave (y), near 0.8278, moving the stop to the entry price removes the risk on the position.
A Risk/Reward Example
| Item | Value |
|---|---|
| Account size | $10,000 |
| Risk per trade (1%) | $100 |
| Stop distance | 50 pips (0.8230 entry, 0.8180 stop) |
| Pip value per standard lot | about $12.15 (10 CHF divided by 0.8230) |
| Position size | about 0.16 lots (16,000 units) |
| Target 1: 0.8353 | 123 pips, about 2.5 to 1 |
| Target 2: 0.8380 | 150 pips, 3 to 1 |
What’s Driving USDCHF Beyond the Chart
SNB vs Fed Policy and the Rate Gap
On September 16, 2026, the Federal Reserve raised the federal funds target range by 25 basis points to 3.75% to 4.00%, its first hike since 2023 (Federal Reserve). The vote was 12 to 0, and the median projection puts the rate at 4.1% at the end of 2026.
On September 24, the Swiss National Bank left its policy rate at 0% and said it is willing to act in the foreign exchange market as needed (SNB). Swiss inflation was 0.8% in August. The result is a yield gap of about 3.9 percentage points in favor of the dollar, which supports the bullish wave count.
Safe-Haven Demand for the Swiss Franc
The franc still draws capital when bond markets come under stress, as the October 2 drop showed. The US September jobs report added only 29,000 jobs and unemployment rose to 4.2%, which weakened the case for a fast second hike. Minutes released October 7 showed all 19 Fed officials backed the September hike, and most expect another by year-end. The next FOMC decision is October 28, and the SNB meets again in December.
How DXY and EURCHF Move with USDCHF
USDCHF tends to move with the US Dollar Index and against EURUSD. EURCHF helps separate dollar moves from franc moves. On October 2, EURCHF fell from 0.9437 to 0.9279, its largest daily drop since June 2022, alongside USDCHF. When both pairs fall together, the franc is driving. When USDCHF falls alone, the dollar is.
Past Double Three Setups on USDCHF
The same pattern has appeared on USDCHF before, in both directions:
- November 2024 (bullish): a seven-swing pullback inside the cycle from the September 6, 2024 low held, and the pair rallied to new highs with 0.8783 as the pivot.
- May 2023 (bearish): a double three bounce on the 4-hour chart found sellers, and the decline resumed.
The pattern itself carries no direction. The larger swing sequence decides whether a double three is a buying setup or a selling setup.
FAQS
What is an Elliott Wave double three?
A double three is a correction made of two simple corrective patterns, W and Y, joined by a corrective X wave. W and Y each have three swings and X adds one, for seven swings in total, and the pattern usually moves sideways.
How is the equal legs zone calculated?
Measure wave (w), then project that length from the end of wave (x). The 100% to 123.6% projection marks the area where wave (y) often ends.
Where did USDCHF find buyers?
USDCHF found buyers inside the 0.8240 to 0.8219 equal legs zone. The correction ended at 0.82267 before the pair turned higher.
What invalidates the bullish USDCHF view?
A break below 0.82267 would mean wave (iv) is still unfolding. The next support would be 0.8208 to 0.8194.
Is USDCHF bullish or bearish right now?
While price holds above 0.82267, the structure favors wave (v) toward 0.8380 and possibly 0.8474.
What moves USDCHF besides technical analysis?
The main drivers are the gap between Fed and SNB interest rates, safe-haven demand for the Swiss franc, and broad dollar strength measured by the DXY.
Free Elliott Wave e-books
 FREE
Elliott Wave Forecasting Guide
A clear introduction to forecasting markets with the Elliott Wave Principle.
Get the free e-book FREE
Elliott Wave Trading Strategies
Practical setups for entries, stops and exits using wave structure.
Get the free e-book FREE
Beginner's Guide to Forex Trading
Forex basics for new traders: pairs, pips, lots, sessions and risk.
Get the free e-book FREE
Guide to Trading Stocks and ETFs
How stock and ETF markets work and how to read them with wave analysis.
Get the free e-bookFree download after a short sign-up with the publisher.
Educational content only. Nothing on this page is financial advice or a recommendation to buy or sell. Trading involves risk and you can lose money. Elliott Wave counts are probabilities, not certainties. Read our full disclaimer and affiliate disclosure.