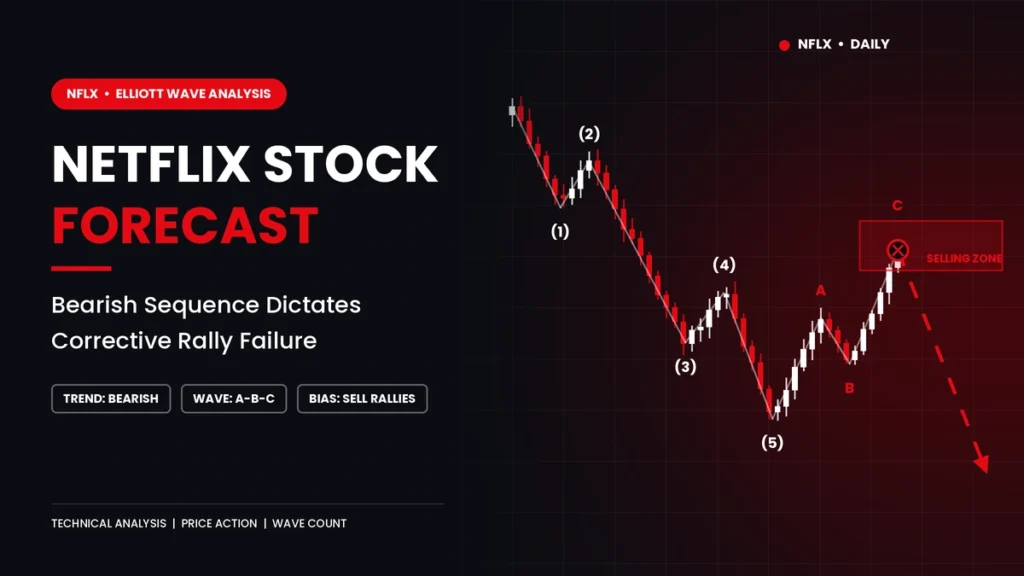
Netflix (NFLX) remains in a bearish Elliott Wave sequence from its June 30, 2025 all-time high of $134.12. The current bounce reads as a wave (2) corrective rally. The primary count expects it to fail below the September 3, 2026 peak, followed by a wave (3) decline toward the $49.78 to $35.80 zone.
Key levels at a glance (as of October 9, 2026)
| Level | Price | Why it matters |
|---|---|---|
| Last price | $71.57 | Down 41% over 12 months |
| Wave (1) low and pivot | $66.54 | October 5 low; wave (2) must hold above it |
| Wave (2) target zone | $75.02 to $77.02 | 50% to 61.8% retracement of the September decline |
| Bearish invalidation | About $83.50 | September 3 peak, next to the 200-day SMA ($83.80) |
| July low | About $65.48 | A break below confirms the larger bearish sequence |
| Larger target zone | $49.78 to $35.80 | Bearish sequence objective from the all-time high |
| Catalyst | October 20, 2026 | Q3 earnings after the close |
Netflix Stock Forecast Summary: What the Elliott Wave Count Shows Now
The primary count is bearish on the larger degree and mildly bullish on the hourly chart. The sequence so far:
- The $134.12 high on June 30, 2025 started the larger decline.
- The September 3, 2026 peak near $83.50 ended a corrective bounce.
- A five-wave drop completed wave (1) at $66.54 on October 5.
- Wave (2) is now rallying as a zigzag. One premium Elliott Wave service places ((i)) at $69.60, ((ii)) at $68.41 and ((iii)) near $71.80.
- Once wave (2) ends, wave (3) lower is expected.
Short-term buyers have room while $66.54 holds. Position traders should watch the $75 to $77 zone for the rally to stall.
Where NFLX Stands Today
Netflix trades at $71.57, down 23.67% in 2026 while the S&P 500 gained 13.49%, according to 24/7 Wall St. on Yahoo Finance. Over 12 months, the stock has lost 41.06%.
Price action since the $134.12 all-time high
The decline has come in clear legs. Shares fell to $65.48 on July 17, 2026, a 23-month low, after Q2 guidance disappointed. A rally followed, reaching $81.18 on August 25 and peaking near $83.50 on September 3. Selling then returned: a 9-week low of $70.10 on September 28, then the $66.54 wave (1) low on October 5.
A note on the 10-for-1 stock split
Netflix completed a 10-for-1 stock split in November 2025, so every level in this article is split-adjusted. The $134.12 high equals about $1,341 on the old pre-split chart. Compare like with like when reading older forecasts.
What Is a Bearish Sequence in Elliott Wave Theory?
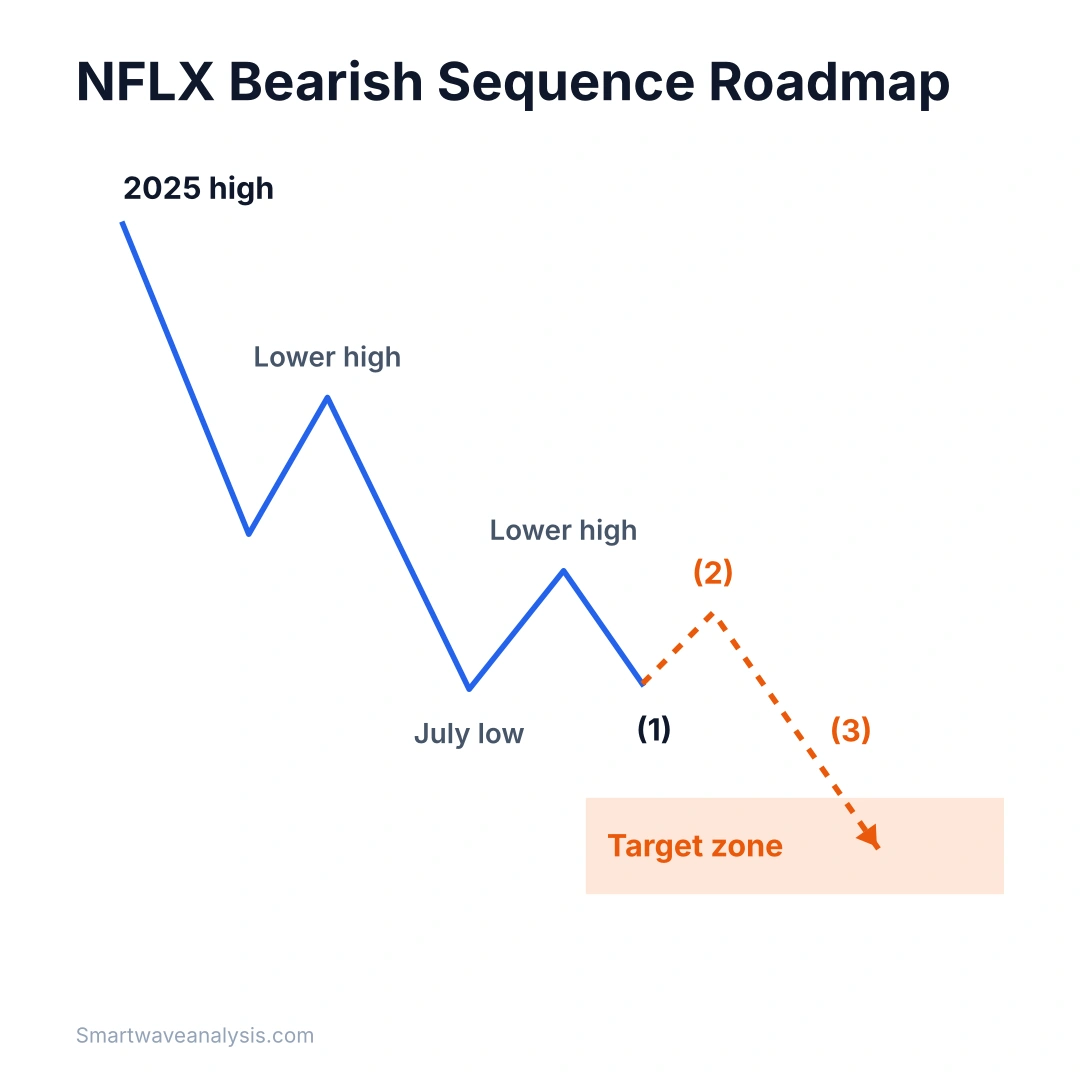
A bearish sequence is a series of lower highs and lower lows that has not yet completed its expected swing count. Until it completes, rallies are treated as corrections, not new uptrends.
Incomplete swing sequences: 3, 7 and 11 swings
Corrections tend to unfold in 3, 7 or 11 swings, while impulses unfold in 5, 9 or 13. When a decline from a major high shows an incomplete count, analysts expect at least one more leg in the same direction. One premium service applies this logic to Netflix from the $134.12 high.
How to read wave degree notation
Brackets show degree. Double parentheses such as ((i)) mark a smaller degree than single parentheses such as (1). Waves ((i)) through ((v)) build wave A, and waves A, B and C build wave (2). This hierarchy comes from Ralph Nelson Elliott and was later codified by A.J. Frost and Robert Prechter in Elliott Wave Principle.
Why corrective rallies tend to fail inside a bearish sequence
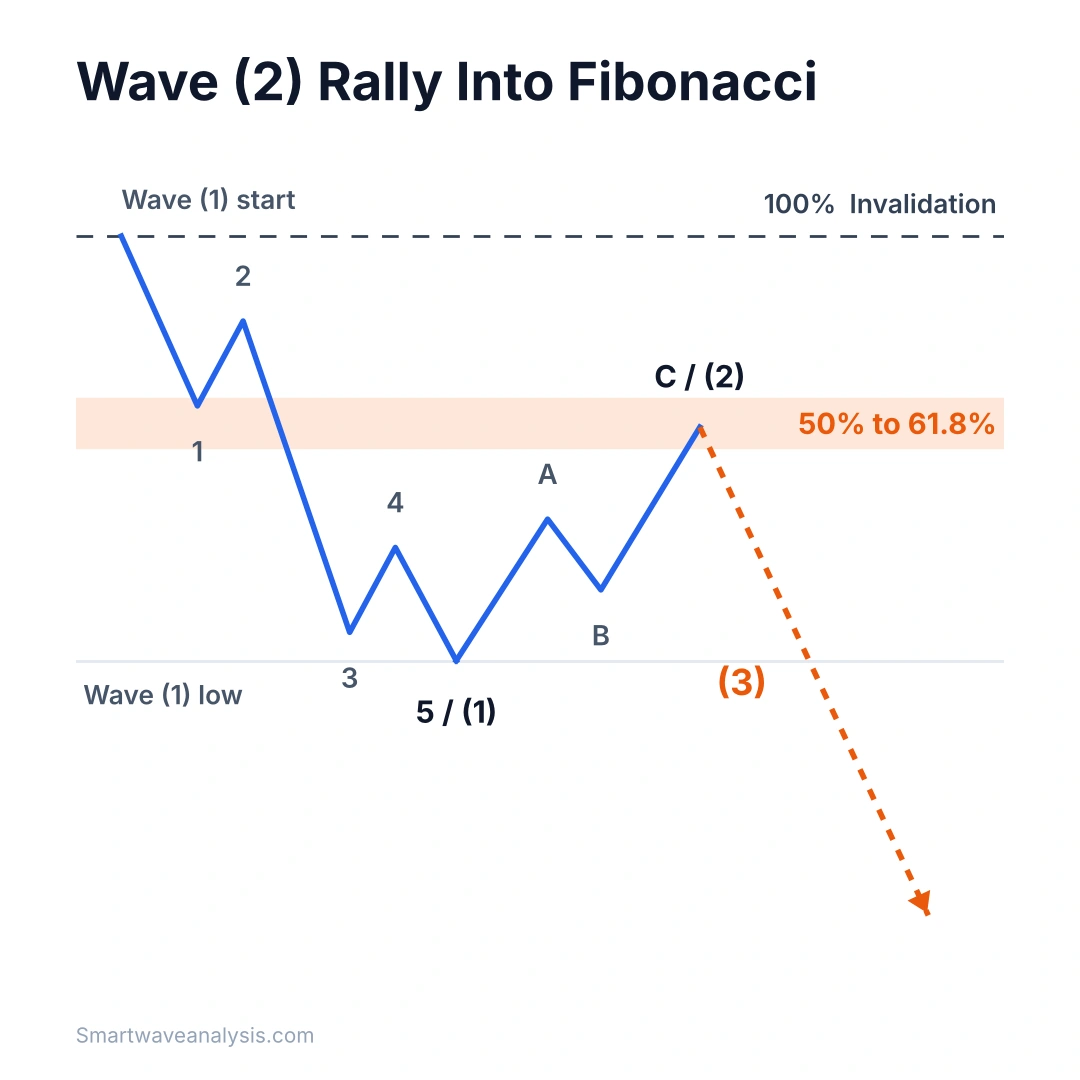
A wave (2) cannot retrace more than 100% of wave (1), which sets a hard ceiling. Most second waves stop between the 50% and 61.8% retracement, where sellers who missed the first leg return.
🚀 Don’t Miss the Next Move
Get daily Elliott Wave counts, live chart updates, and high-probability trade setups across crypto, forex, and stocks — before the market moves.
👉 Start Your 14-Day Trial for Just $0.99 →Cancel anytime. No long-term commitment. (Affiliate link — we may earn a commission at no extra cost to you.)
NFLX Multi-Timeframe Elliott Wave Analysis
Monthly chart: the cycle from the 2025 peak
The June 30, 2025 high at $134.12 capped a multi-year advance. By the July 2026 low, the stock had given back 51% of its value. This larger corrective cycle is the base of the bearish sequence.
Weekly chart: lower highs and a broken neckline
The weekly chart shows lower highs near $109 in April 2026 and near $83.50 in September. Several TradingView chartists also flag a completed head-and-shoulders top, with price below its neckline.
Daily chart: five waves down into $66.54
From the September 3 peak, the drop into October 5 subdivided into five waves. That shape marks an impulse, which is why it is labelled wave (1) and not a finished correction.
30-minute chart: the wave (2) zigzag in progress
The rally from $66.54 has printed ((i)) at $69.60, ((ii)) at $68.41 and ((iii)) near $71.80. A ((iv)) dip and a ((v)) push should finish wave A. Wave B then pulls back in 3 swings before wave C completes wave (2).
Wave (2) Corrective Rally: Fibonacci Targets for NFLX
Measured from about $83.50 down to $66.54, the September decline spans $16.96. That gives this retracement grid:
| Retracement | Price |
|---|---|
| 38.2% | $73.02 |
| 50% | $75.02 |
| 61.8% | $77.02 |
| 78.6% | $79.87 |
Wave A: completing ((iv)) and ((v))
With ((iii)) near $71.80, a ((v)) push into the $72 to $73 area would tag the 38.2% level and finish wave A.
Wave B and wave C targets
Wave B should hold above $66.54. Wave C most often equals wave A in length. If wave A ends near $73 and wave B retraces half of it, an equal C leg lands near $76.23, inside the $75 to $77 band.
Why $75 to $77 is the zone to watch
Three references cluster there: the 50% to 61.8% retracement, the 50-day SMA at $75.48, and old support near $75 that broke in September. When three methods agree on one band, a corrective rally usually stalls there.
Where the Bearish Sequence Points Next
Wave (3) downside projections
Wave (3) is often the longest wave. Assuming wave (2) tops near $77.02, a wave (3) equal to wave (1) reaches about $60.06. A 161.8% extension reaches about $49.58.
How the $49.78 to $35.80 zone is calculated
One premium service publishes $49.78 to $35.80 as the larger target but does not show its math. Our independent 161.8% projection of wave (1) lands at $49.58, within 20 cents of the top of that zone. Two separate methods meeting at the same price strengthens the case for $50 as the first major objective.
Invalidation Levels: What Would Break This Count
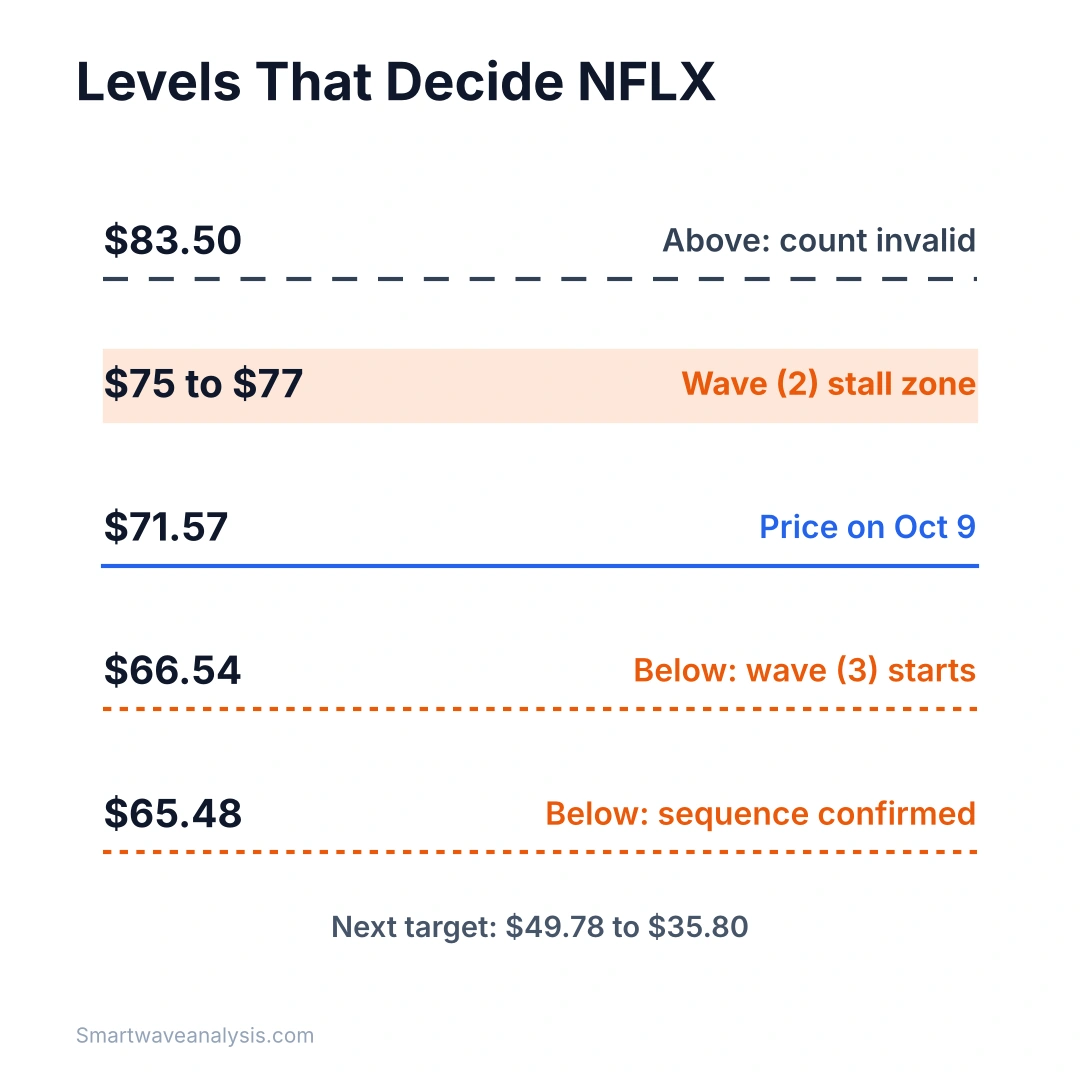
- Below $66.54 before wave (2) completes: wave (2) ended early, and wave (3) has started. Still bearish.
- Below the July low near $65.48: confirms the larger bearish sequence and removes the higher-low argument.
- Above about $83.50: wave (2) cannot exceed the start of wave (1). A break above the September peak, which also sits at the 200-day SMA of $83.80, invalidates the bearish count.
Alternate Counts: How Other Elliott Wave Analysts Read Netflix
Elliott Wave analysts disagree on Netflix right now. Here is how the published views compare.
| Source | Count | Implication |
|---|---|---|
| Premium wave service (Oct 9, 2026) | Bearish sequence; wave (2) rally from $66.54 | Rally fails, then wave (3) toward $49.78 to $35.80 |
| Independent analyst (Jul 23, 2026) | Wave 5 of C ending an ABC correction | Bottom in $50 to $60, then a larger rebound |
| TradingView chartist (W-X-Y view) | Wave (A) done near $65 | Wave (B) to $80 to $92, then wave (C) toward $49.86 |
| TradingView chartist (multi-year view) | Five-wave advance ended at $134 | Wave B bounce, then wave C to new lows |
| Smart Wave Analysis | Bearish sequence; wave (2) in progress | Stall at $75 to $77; wave (3) to $60.06, then $49.58 |
The higher-low question: October low vs the July low
Bulls point out that the October 5 low at $66.54 held above the July low near $65.48, which is a higher low. In our count, the July low ended a larger-degree leg, the August to September rally was a corrective bounce, and the September decline began a new leg. A daily close below $65.48 removes the higher low and confirms the bearish sequence. Until then, the bullish reading has a case.
Revisiting July’s $50 to $60 final wave forecast
Horvat’s July 23 call expected wave 5 of C to bottom between $50 and $60. Price had already turned up from about $65 on July 17 and rallied roughly 27% into September without reaching that zone. Either wave 5 truncated near $65, or the final low is still ahead. The bearish sequence favors the second view, which keeps $50 to $60 in play.
Technical Confluence: Moving Averages, RSI and Chart Patterns
The evidence outside wave counting lines up with the bearish view:
- Moving averages: price trades below the 50-day SMA ($75.48) and the 200-day SMA ($83.80). The September rally stopped at the 200-day.
- Momentum: on September 21, a TradingView analysis recorded RSI at 27.64 and a fast EMA crossing below the slow EMA, the first such cross since April.
- Pattern: chartists flag a weekly head-and-shoulders breakdown, a bearish continuation signal.
- Support: $70 has acted as support several times in 2026. A weekly close below it exposes the $66.54 and $65.48 lows.
Why Is Netflix Stock Down? The Fundamental Backdrop
Netflix stock is down because content spending is rising faster than viewing and revenue growth is slowing, even though the business remains highly profitable. Figures below come from 24/7 Wall St. unless noted.
The bear case: content costs, engagement and downgrades
- Content expense should rise about 10% in 2026, while viewing hours grew only 2% in the first half.
- Q2 free cash flow fell to $1.53 billion from $2.27 billion.
- Q2 revenue of $12.56 billion missed the $12.58 billion estimate, and Q3 guidance calls for 11% FX-neutral growth.
- Netflix will publish its detailed engagement report only once a year starting in 2027.
- Competition is rising from YouTube, live sports and the combined Paramount and Warner Bros.
The bull case: buybacks, free cash flow and ad revenue
- Forward P/E of 19, with FY2026 revenue guidance of $51.0 to $51.4 billion and a 31.5% operating margin.
- About $12.5 billion of expected 2026 free cash flow.
- A record $4.7 billion buyback last quarter, with $27.1 billion still authorized.
- Ad revenue on track to roughly double to about $3 billion in 2026.
Netflix analyst ratings and price targets
Of 51 analysts, 35 rate the stock Buy or Strong Buy, 15 Hold and 1 Sell. The consensus target is $92.55. Goldman Sachs holds Buy with a $90 target, and Deutsche Bank upgraded to Buy at $95. Targets have been falling, and price sits well below all of them.
Netflix Q3 2026 Earnings (Oct 20): How the Report Fits the Wave Count
Netflix will post Q3 2026 results on Tuesday, October 20, 2026, at about 1:01 p.m. Pacific Time. A 1:45 p.m. video interview follows with co-CEOs Greg Peters and Ted Sarandos and CFO Spence Neumann (Netflix Investor Relations). Guidance calls for $12.86 billion in revenue and $0.82 in diluted EPS.
Beat scenario: wave C of (2) extends higher
A clean beat with faster engagement could push wave C into the $77 to $80 area, the 61.8% to 78.6% retracement. The count stays bearish while price holds below about $83.50.
Miss scenario: wave (3) lower begins early
Two of the last four quarters brought EPS misses, including a 15.79% shortfall in Q3 FY25. Another miss could end wave (2) early and drive a break below $66.54, starting wave (3) toward $60.
NFLX Trading Plan: Scenarios, Triggers and Risk
| Scenario | Trigger | Targets | Invalidation |
|---|---|---|---|
| Primary: wave (2) fails | Bearish reversal inside $75 to $77 | $66.54, then $60.06 | Above $83.50 |
| Early wave (3) | Daily close below $66.54 | $60.06, then $49.58 | Back above $71.80 |
| Bullish alternate | Daily close above $83.50 | $92 area, near the $92.55 consensus | Back below $77 |
Stop placement and position sizing
Place stops beyond the level that proves the count wrong, not at a fixed dollar amount. A short from $76 with a stop above $83.50 risks about $7.50 per share. Against a first target of $66.54, that is about 1.3 to 1; holding for $60.06 lifts it to about 2.1 to 1. Size each position so a full stop costs no more than 1% to 2% of account equity.
FAQS
Is Netflix stock in a bearish Elliott Wave sequence?
Yes, on the primary count. The decline from the $134.12 high on June 30, 2025 shows an incomplete bearish sequence. Rallies, including the current wave (2), are expected to fail before lower prices.
What is the next downside target for NFLX?
After wave (2) ends, the first target is about $60.06, where wave (3) equals wave (1). The larger objective is the $49.78 to $35.80 zone.
What price invalidates the bearish Netflix forecast?
A break above the September 3, 2026 peak near $83.50 invalidates the bearish count. That level also sits next to the 200-day SMA at $83.80.
How high can the Netflix wave (2) rally go?
The most likely ceiling is $75.02 to $77.02, the 50% to 61.8% retracement of the September decline. The 50-day SMA at $75.48 sits inside that band.
When is the Netflix Q3 2026 earnings date?
Tuesday, October 20, 2026, at about 1:01 p.m. Pacific Time. Management then hosts a live video interview at 1:45 p.m.
Did Netflix stock split?
Yes. Netflix completed a 10-for-1 split in November 2025, so all current chart levels are split-adjusted.
Free Elliott Wave e-books
 FREE
Elliott Wave Forecasting Guide
A clear introduction to forecasting markets with the Elliott Wave Principle.
Get the free e-book FREE
Elliott Wave Trading Strategies
Practical setups for entries, stops and exits using wave structure.
Get the free e-book FREE
Beginner's Guide to Forex Trading
Forex basics for new traders: pairs, pips, lots, sessions and risk.
Get the free e-book FREE
Guide to Trading Stocks and ETFs
How stock and ETF markets work and how to read them with wave analysis.
Get the free e-bookFree download after a short sign-up with the publisher.
Educational content only. Nothing on this page is financial advice or a recommendation to buy or sell. Trading involves risk and you can lose money. Elliott Wave counts are probabilities, not certainties. Read our full disclaimer and affiliate disclosure.