
- August 6, 2026
- Posted by: George
- Category: News
Quick answer: The Blue Box is a Fibonacci-based price zone where Elliott Wave traders expect a correction to finish before the primary trend resumes. Traders buy (or sell) inside the zone, place a stop just outside it, and target the next leg of the trend.
Key Takeaways
- A Blue Box is a Fibonacci-based price zone where an Elliott Wave correction is projected to end.
- It’s built from Equal Legs — a measurement comparing two connected corrective swings.
- Russell 2000 (RTY) futures trade on CME Group and are known for sharp, fast wave structures, which makes them a popular instrument for this setup.
- The setup works best inside an established trend, not as a reversal tool.
- No zone guarantees a win — risk management and trend context still decide the outcome.
The Russell 2000 has been one of the strongest major U.S. indices in 2026. While the Dow, Nasdaq, and S&P 500 have spent stretches moving sideways, the small-cap benchmark keeps pushing to new highs. That strength has made its futures contract, RTY, a favorite among short-term Elliott Wave traders looking for repeatable pullback-buying setups.
One setup shows up again and again in RTY analysis this year: price pulls back, drops into a specific zone marked on the chart, and buyers appear almost on cue. That zone is called the Blue Box, and understanding how it’s built can change how you read every pullback you trade — in the Russell 2000 or anywhere else.
What Is the Russell 2000 (RTY) Futures Contract?
The Russell 2000 Index tracks 2,000 small-cap U.S. companies. It was launched by the Frank Russell Company in 1984 and is maintained today by FTSE Russell, part of the London Stock Exchange Group. It’s the main benchmark for how smaller, domestically focused businesses are performing, which makes it more sensitive to interest rates and U.S. economic data than large-cap indices like the S&P 500.
The E-mini Russell 2000 futures contract (RTY) trades on CME Group, nearly 24 hours a day, five days a week. Because small caps swing harder than large caps, RTY tends to produce bigger, faster moves — exactly what short-term Elliott Wave traders look for.
| Contract Detail | Specification |
|---|---|
| Ticker | RTY (E-mini), M2K (Micro E-mini) |
| Exchange | CME Group (Globex) |
| Contract Value | $50 x index price (E-mini) |
| Minimum Tick | 0.10 points = $5 |
| Trading Hours | Sun–Fri, 5:00 PM–4:00 PM CT (brief daily halt) |
| Expiration | Quarterly — 3rd Friday of Mar, Jun, Sep, Dec |
| Settlement | Cash-settled |
Quick answer: RTY is the CME Group futures contract tracking the Russell 2000 Index. It offers near-24-hour trading and higher leverage than the IWM ETF, which is why active traders often prefer it for short-term setups.
If you want to compare RTY to other major indices in real time, our live Elliott Wave charts update automatically and cover every major index side by side.
What Is a “Blue Box” in Elliott Wave Trading?
Definition: A Blue Box is a shaded price zone on a chart marking where a market correction is statistically likely to complete, based on a Fibonacci measurement called Equal Legs.
Here’s the idea in plain terms. Most corrective waves move in related legs. When a pullback has two connected swings — call them Leg A and Leg Y — the second leg often finishes at roughly the same length as the first, or at a common Fibonacci ratio of it, such as 61.8%, 100%, or 161.8%. When price reaches that projected level, it lands inside a small range. Traders shade that range on the chart, usually in blue, and that shaded area is the Blue Box.

Quick answer: A Blue Box turns a vague idea — “this pullback should end soon” — into an exact, tradeable price range. It tells you where to look for buyers, where to place your stop, and how much you’re risking before you ever enter the trade.
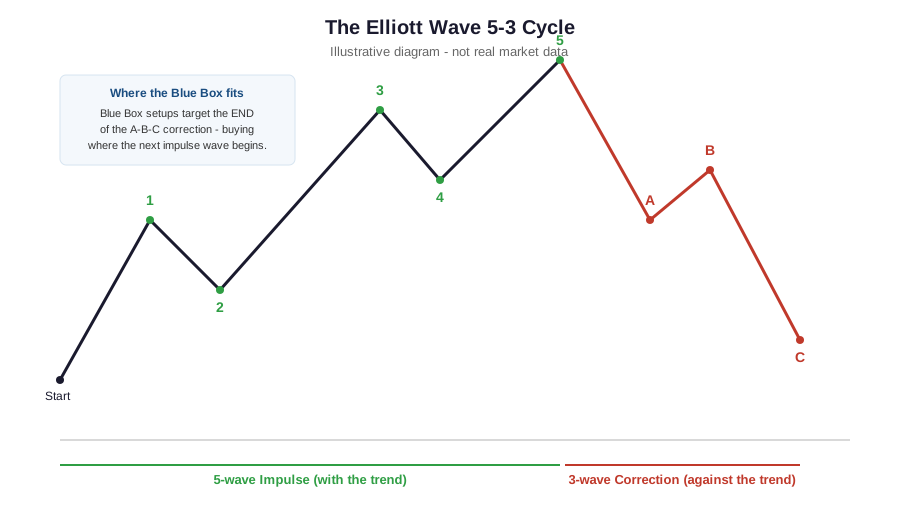
This concept sits inside the wider Elliott Wave framework, which separates price action into impulsive waves (moves in the direction of the trend) and corrective waves (moves against it). If terms like these are new to you, our Elliott Wave Theory for Beginners guide walks through the basics before you tackle a setup like this one.
Blue Box vs. a Standard Support Zone
| Feature | Blue Box | Traditional Support Zone |
|---|---|---|
| Basis | Fibonacci Equal Legs projection | Historical price reaction |
| Precision | Narrow, defined range | Often a wider area |
| Method | Measured from wave structure | Drawn visually from past lows |
| Confirms | Wave count and trend context | Price memory alone |
| Best used for | Entries with tight, planned risk | General areas of interest |
Pro tip: A Blue Box that lines up with an older horizontal support level is a stronger signal than either tool used alone. That overlap is called Fibonacci confluence, and it’s one of the fastest ways to filter A-grade setups from average ones.
Why Buyers Often Step In at the Blue Box
The Blue Box works because it stacks several things in a trader’s favor at once:
- Defined risk. Since the zone has a clear upper and lower edge, your stop-loss sits just below it — not somewhere random.
- Fibonacci confluence. When multiple Fibonacci levels line up in the same small area, more traders are often watching the same zone, which can add genuine buying liquidity.
- Trend alignment. The setup is used inside a larger trend. You’re not guessing at a reversal — you’re looking for trend continuation, the next leg of a move already in motion.
- Clean market structure. A sharp reaction from the box, followed by a break of the prior swing high, confirms the correction is over and the uptrend has resumed.
That combination is what lets traders keep their risk-reward ratio favorable — small, known risk against an open-ended reward if the trend continues.
🚀 Don’t Miss the Next Move
Get daily Elliott Wave counts, live chart updates, and high-probability trade setups across crypto, forex, and stocks — before the market moves.
👉 Start Your 14-Day Trial for Just $0.99 →Cancel anytime. No long-term commitment. (Affiliate link — we may earn a commission at no extra cost to you.)
Breaking Down the Double Zigzag Correction
Many of the strongest Blue Box reactions in RTY this year formed after a pattern called a double zigzag.
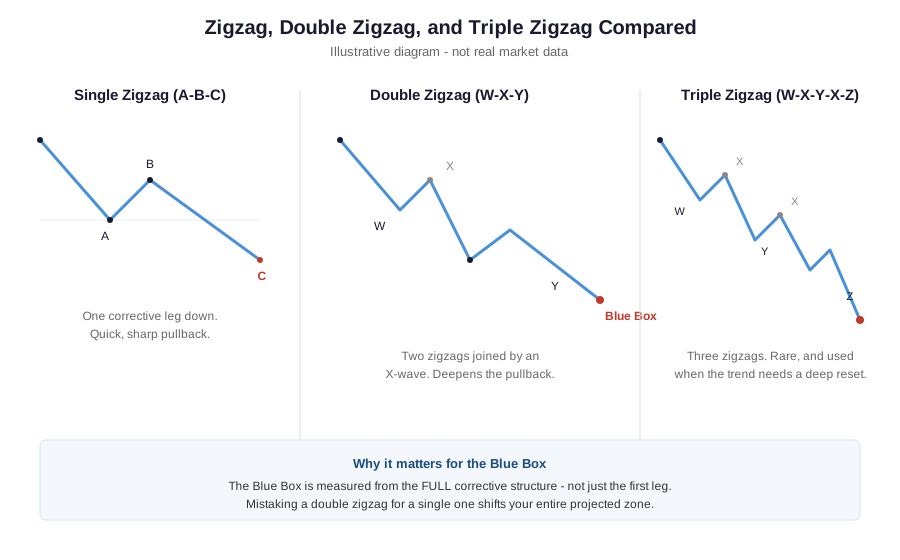
A single zigzag is a simple three-wave corrective wave, often labeled A-B-C. It’s sharp and doesn’t take much time. But sometimes one zigzag isn’t enough to fully reset momentum before the trend can continue. When that happens, price forms a second zigzag, connected to the first by a smaller corrective wave in the middle. Analysts label this three-part pattern W-X-Y.
Think of it like a runner who stumbles, catches their balance, then stumbles once more before finding their footing for good. The double zigzag is the market doing the same thing — two dips instead of one — before the primary trend resumes.
Quick answer: A double zigzag is a corrective pattern made of two zigzags (A-B-C each) joined by a connecting wave, labeled W-X-Y. It shows up when a single zigzag doesn’t correct price deeply enough to reset the trend.
Spotting a double zigzag matters because it changes where the Blue Box sits. The zone is measured from the full W-X-Y structure and its wave degree — the relative size of the pattern on your timeframe — not just the first leg down. Mistaking a double zigzag for a single one usually means marking your box in the wrong place.
A Real Russell 2000 Example: How the Blue Box Setup Played Out
In July 2026, RTY futures pulled back from a fresh high. On the hourly chart, that pullback took the shape of a double zigzag. Elliott Wave Forecast, an established Elliott Wave subscription service, published a Blue Box zone for the move, projecting where the correction should complete before the index turned higher again.
The following session, price reacted almost exactly where the zone predicted. RTY bounced, buyers who had entered near the box moved their stops to breakeven once the first target was hit, and the index went on to test new highs shortly after.
This kind of outcome isn’t guaranteed every time — no trading tool is perfect — but it illustrates why the Blue Box concept has stuck around. When the wave count is right, the reaction tends to be sharp and fast, which is exactly what short-term traders want.
Expert insight: Experienced Elliott Wave traders don’t buy every Blue Box they see. They confirm trend strength, check that the corrective structure is actually complete, and read the broader market context before entering — the zone is a starting point for analysis, not a signal to act on by itself.
How to Build Your Own Blue Box Trading Plan
You don’t need a paid service to use this framework — you need a process. Here’s how to apply it step by step.
1. Identify the higher-degree trend first. Before you touch a smaller timeframe, confirm the bigger trend on the daily or weekly chart. The Blue Box setup only works when you’re buying a dip inside an established uptrend, not trying to call a reversal.
2. Wait for a clear corrective pattern. Let the pullback finish forming before you act. Common shapes to watch for are a single zigzag, a double zigzag, a triple zigzag, or a flat correction. Acting before the pattern completes is one of the most common mistakes new wave traders make.
3. Measure the Equal Legs zone. Use a Fibonacci extension tool to project where the second leg of the correction is likely to equal, or extend to a common ratio of, the first leg. Mark that small range on your chart — that’s your Blue Box.
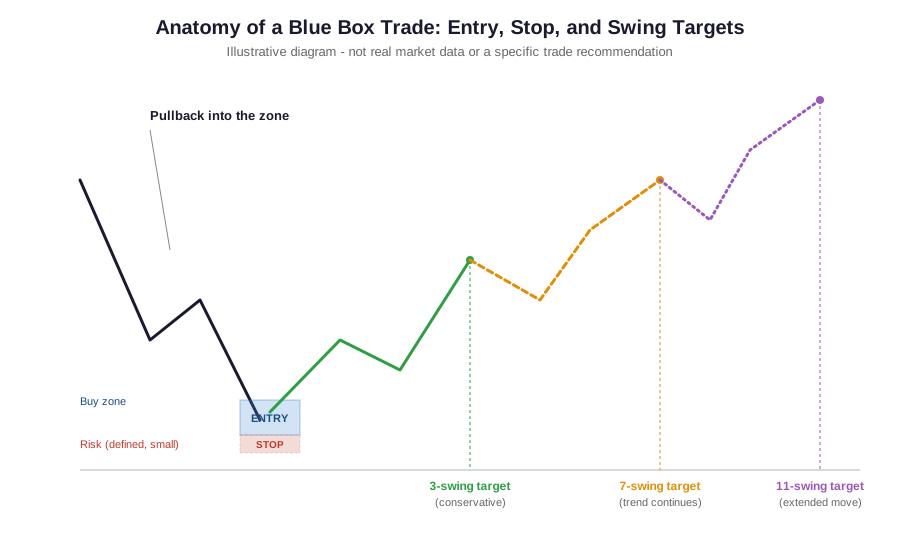
4. Set your entry and invalidation level together. Decide where you’ll buy inside the box and where you’ll exit if you’re wrong, before you place the trade. Your stop typically goes just below the box, so the risk is small and known in advance.
5. Plan your exit in swings, not guesses. Elliott Wave traders often talk about targets in terms of “swings.” In plain terms, a swing is one clean push in a single direction before a pause or pullback. A 3-swing target is a conservative, short bounce. A 7- or 11-swing target expects the market to keep making new highs across several waves before the move is done. Decide which target you’re playing for ahead of time so you don’t exit too early or hold on too long.
6. Manage risk after the first reaction. Once price moves in your favor and reaches an initial target, many traders move their stop to breakeven and take partial profits. This locks in a risk-free position for whatever comes next.
Blue Box Entry Checklist
- Higher-timeframe trend confirmed as bullish (or bearish for shorts)
- Corrective pattern (zigzag, double zigzag, flat) has fully completed
- Equal Legs zone measured with a Fibonacci extension tool
- Entry and invalidation level set before entering
- Position size calculated against a defined stop
- Swing target (3, 7, or 11) decided in advance
If you’d rather work through position sizing and risk-reward math automatically, our free Trading Calculators do the math for you before you ever place a trade.
Common Mistakes Traders Make With the Blue Box
- Buying before the correction finishes. Entering mid-pattern, before the final leg completes, is the single most common error.
- Ignoring the higher timeframe. A perfect-looking Blue Box on a 15-minute chart means little if the daily trend is against you.
- Using the wrong Fibonacci anchor points. Small errors in where you start and end the measurement shift the entire zone.
- Skipping the stop-loss. Without a defined invalidation level, a “small pullback” can turn into a full trend reversal against you.
- Trading against the dominant trend. The Blue Box is a continuation tool. Using it to pick tops or bottoms against a strong trend is a different — and riskier — strategy entirely.
Does the Blue Box Work Beyond the Russell 2000?
Quick answer: Yes. The Blue Box is a technical analysis concept based on Fibonacci math and wave structure, not something specific to one market. It applies anywhere price moves in trends and corrections — forex pairs, crypto, individual stocks, and other index futures.
What changes between markets is market momentum and volatility. A Blue Box in a fast-moving crypto pair may resolve in hours, while the same setup on a slower forex pair can take days. The underlying logic — Equal Legs projecting a zone, trend context confirming it — stays the same across every market.
Risk Management: Why the Blue Box Alone Isn’t Enough
No setup wins every time, and the Blue Box is no exception. Wave counts can be relabeled as new price action comes in, and a zone that looks solid can still fail if the broader trend shifts underneath it.
That’s why the box should never be the only thing you’re relying on. Always define your invalidation level before entering, size your position so a loss doesn’t hurt, and treat every Blue Box as a probability in probability trading — not a guarantee. A favorable risk-reward ratio, typically 1:2 or better, means you can be wrong more often than you’re right and still come out ahead over time. Pairing the setup with a full understanding of Elliott Wave structure, covered in our Elliott Wave Trading Guide, will help you judge which Blue Box setups are worth taking and which ones to skip.
Frequently Asked Questions
What is a Blue Box in Elliott Wave trading?
A Blue Box is a shaded price zone marking where a correction is projected to end, based on a Fibonacci Equal Legs measurement. Traders use it to plan entries, stops, and targets around one defined range.
Is the Russell 2000 (RTY) good for Elliott Wave trading?
Yes. RTY tends to move in clean, well-defined waves because small-cap stocks react strongly to shifts in risk appetite and interest rates, giving Elliott Wave traders frequent, tradable setups.
What’s the difference between a zigzag and a double zigzag?
A zigzag is a single three-wave pullback (A-B-C). A double zigzag is two zigzags joined by a smaller connecting wave, labeled W-X-Y. It shows up when one zigzag isn’t enough to fully correct the prior move.
How many swings should I expect after a Blue Box reaction?
It varies by setup. A conservative target is a 3-swing bounce, while stronger trends can extend to 7 or 11 swings. Deciding your target in advance is part of managing the trade well.
Does the Blue Box repaint?
The zone itself is based on a completed wave structure, so once the corrective pattern is fully finished, the box doesn’t move. It can shift before the pattern completes, though, if the wave count needs to be relabeled.
Is the Blue Box better than support and resistance?
Neither replaces the other. The Blue Box adds Fibonacci precision and wave context; horizontal support and resistance add historical price memory. Used together, through Fibonacci confluence, they tend to outperform either tool alone.
Can beginners use the Blue Box strategy?
Yes, but beginners should learn the basics of impulsive and corrective waves first. Trying to spot Equal Legs zones without understanding wave structure often leads to mismeasured boxes.
Which timeframe works best for the Blue Box setup?
It works on any timeframe, but the box is more reliable on higher timeframes (4-hour, daily) where wave counts are cleaner. Lower timeframes produce more setups but also more noise.
Does the Blue Box work in forex?
Yes. The same Fibonacci and wave-structure logic applies to any liquid forex pair with a clear trend and corrective structure.
Does the Blue Box work in crypto?
Yes, though crypto’s higher volatility means zones can be reached and reversed faster. Wider stops or smaller position sizes are common adjustments.
Does the Blue Box work on individual stocks?
Yes, particularly on liquid, trending stocks. Low-volume or highly news-driven stocks can distort the wave structure and make the zone less reliable.
What’s a good risk-reward ratio for a Blue Box trade?
Many traders look for at least 1:2 — risking one part to make two — since the tight stop the Blue Box provides makes favorable ratios easier to achieve.
Is confirmation required before entering at the Blue Box?
Most experienced traders wait for some sign of a reaction — a reversal candle, a break of a short-term trendline, or a momentum shift — rather than buying blindly the moment price touches the zone.
What causes a Blue Box setup to fail?
The most common cause is a mislabeled wave count. If the corrective pattern wasn’t actually finished, or the wrong anchor points were used for the Fibonacci measurement, the projected zone will be wrong.
Can this setup be automated or scanned for with AI tools?
Wave counting still involves judgment calls that are difficult to fully automate, though tools can flag likely Fibonacci confluence zones. Most traders use software to measure the levels, then apply their own judgment on trend and structure before entering.
In Short
- Blue Box = a Fibonacci Equal Legs price zone marking where a correction likely ends
- Best used in = an established trend, for continuation trades
- Entry = inside the Blue Box, after signs of a reaction
- Stop = just below (or above, for shorts) the box
- Target = the next impulsive leg, sized in 3, 7, or 11 swings
- Works in = futures, forex, crypto, and stocks — any trending, liquid market
Final Takeaway
The Blue Box isn’t magic — it’s a structured way to answer one question every trader asks during a pullback: where is this likely to end? By combining Elliott Wave structure with Fibonacci’s Equal Legs measurement, you get a defined zone, a defined risk, and a clear plan before you ever click buy.
If you’re new to wave counting, start with our Elliott Wave Theory page for the foundational rules, then download our free Elliott Wave Trading Blueprint eBook to see the full framework applied across real charts — no email or sign-up required.
This article is for educational purposes only and is not financial advice. Trading futures and other leveraged instruments carries substantial risk of loss.