
- July 13, 2026
- Posted by: George
- Category: News
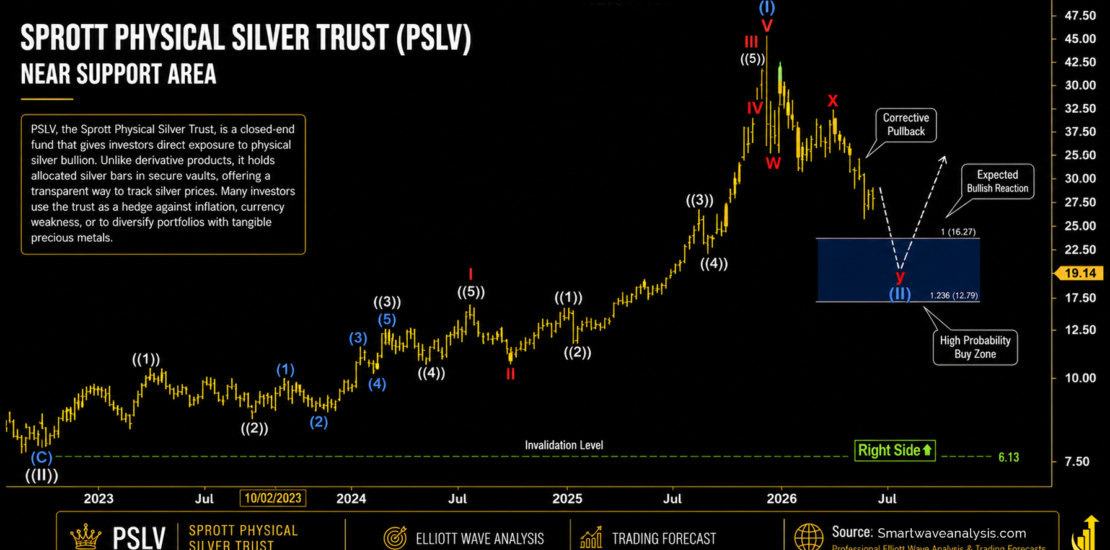
The weekly structure suggests that PSLV is approaching a major support area where the current higher-degree correction may attempt to complete. The developing Elliott Wave pattern points toward an important price region that could determine whether the broader bullish sequence is ready to resume.
PSLV Weekly Market Overview
PSLV provides exposure to physical silver bullion and is widely followed by market participants seeking a way to track movements in the silver market. Because silver can respond to changes in inflation expectations, currency conditions, real interest rates, industrial demand, and broader risk sentiment, its long-term price structure often attracts technical traders as well as investors.
From an Elliott Wave perspective, the weekly chart shows a powerful advance from the August 2022 low. That rally appears to have completed a five-wave impulsive sequence at a higher degree. Since reaching the major peak, price has entered a broader corrective phase that may still require another decline before the next meaningful recovery can develop.
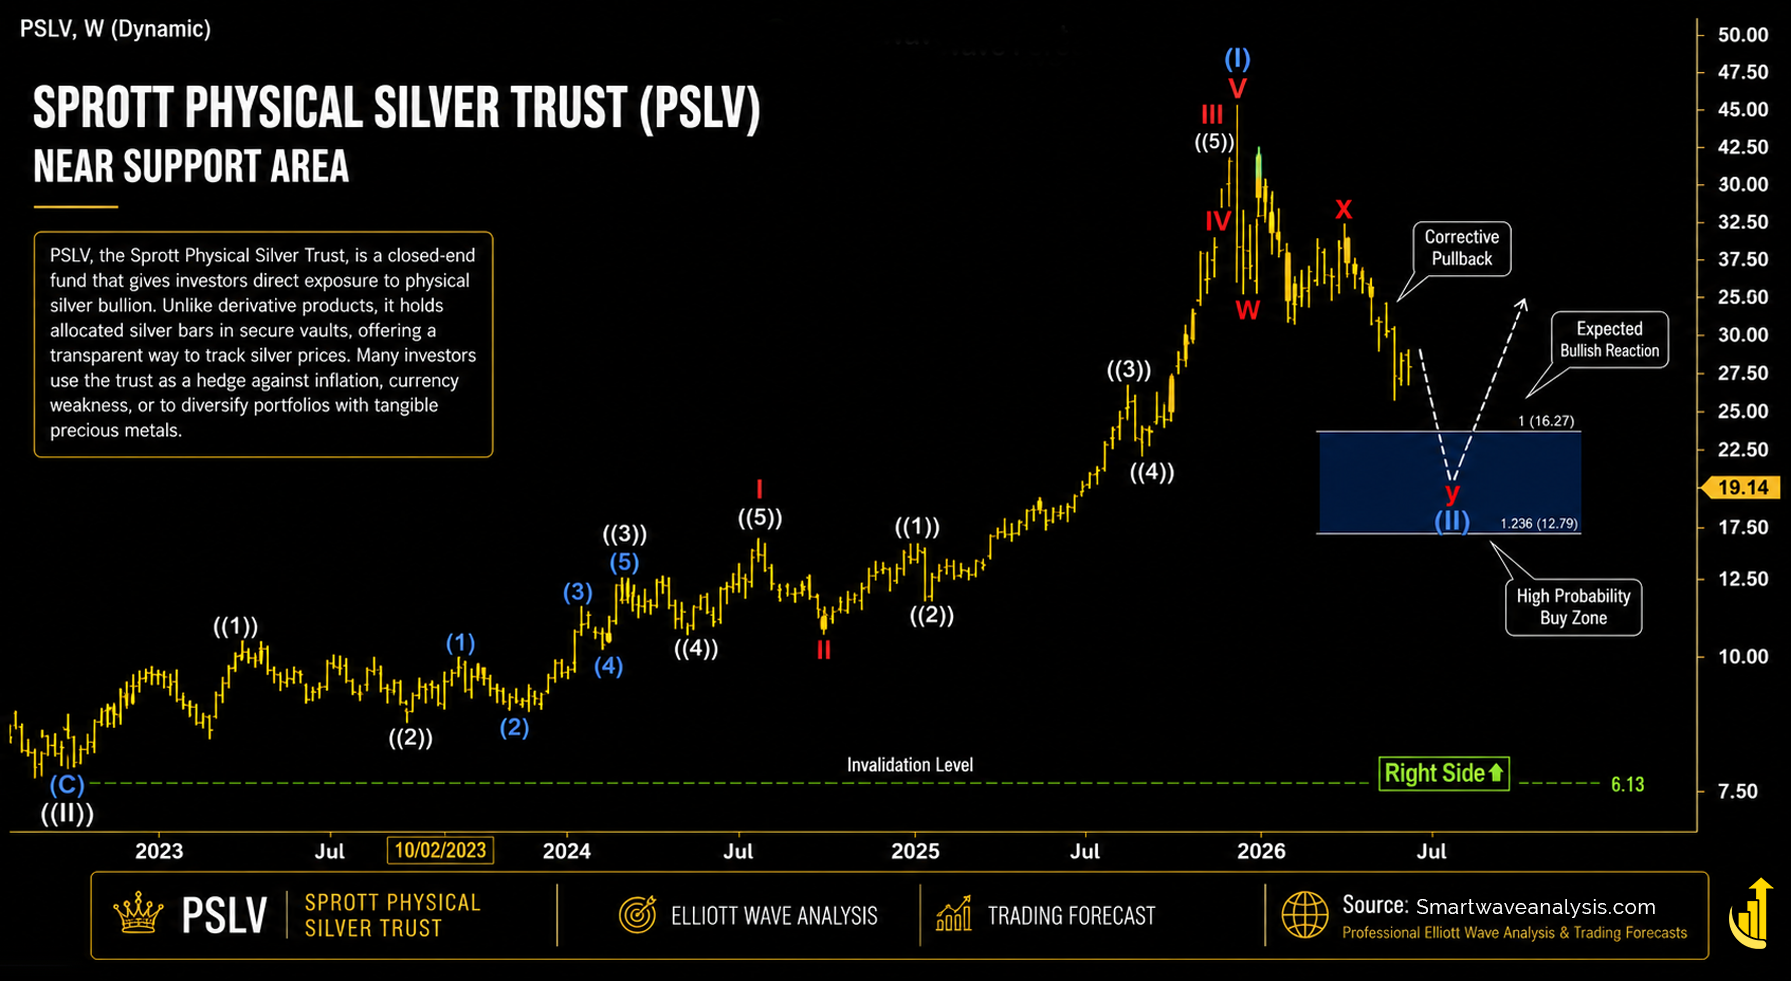
The central area of interest is the $12.79 to $16.27 support zone. This region represents the projected completion area for the current corrective sequence. If buyers respond from this zone and the wave structure confirms a low, the market could begin a new recovery phase.
What Is the Main PSLV Elliott Wave Outlook?
The primary technical scenario is that PSLV remains in a higher-degree wave (II) correction after completing wave (I) at $38.13. The correction is developing as a possible double-three structure, commonly expressed as w-x-y.
Under this interpretation, wave y may continue toward the $12.79–$16.27 support area. A completed corrective structure and a clear bullish reaction from that region could create the conditions for at least a three-wave recovery.
How the Weekly Elliott Wave Structure Developed
The broader bullish sequence began after PSLV established an important low at $6.13 on August 29, 2022. From that point, price advanced through a five-wave impulsive structure.
- Wave I: The first major advance carried price from the 2022 low to approximately $11.77.
- Wave II: A corrective pullback followed and reached approximately $9.60.
- Wave III: Strong upside momentum then extended the rally to around $33.25.
- Wave IV: Price corrected from the wave III high and formed a pullback near $29.56.
- Wave V: The final push reached approximately $38.13, completing the larger wave (I).
The completion of a five-wave advance is significant because Elliott Wave theory generally expects a corrective phase after an impulse has finished. The decline from $38.13 is therefore being monitored as a potential higher-degree wave (II).
Wave (II) Correction and the Developing W-X-Y Pattern
The decline from the wave (I) peak does not currently appear to be a simple straight-line correction. Instead, the price action can be interpreted as a more complex double-three correction.
In this structure, the first corrective leg, labeled w, declined to approximately $23.28. Price then produced an intervening recovery in wave x, reaching approximately $31.00. The market subsequently turned lower again, opening the possibility that wave y is now developing.
If this interpretation remains valid, wave y may continue to extend toward the projected support region. The purpose of this zone is not to identify an exact turning point in advance. Instead, it defines an area where traders can begin watching for evidence that selling pressure is weakening and a corrective low may be forming.
Key PSLV Price Levels to Watch
| Technical Level | Price | Why It Matters |
|---|---|---|
| Projected Support Zone | $12.79 – $16.27 | Potential completion region for wave (II) |
| Wave (I) High | $38.13 | Completion point of the larger bullish impulse |
| Wave III High | $33.25 | Major extension within the previous impulse |
| Wave IV Area | Approximately $29.56 | Previous corrective reference point |
| Wave w Low | $23.28 | First completed leg of the larger correction |
| Wave x High | $31.00 | Corrective rebound before the current decline |
| Major Invalidation Level | $6.13 | Critical reference level for the broader bullish interpretation |
Why the $12.79–$16.27 Support Zone Matters
The projected support area is important because it represents a technical region where the current corrective sequence may reach completion. In Elliott Wave analysis, a target zone is more useful when it is treated as an area of interest rather than an automatic buy signal.
Price can enter a projected support region and continue moving lower. For that reason, the reaction inside the zone matters as much as the zone itself. A stronger setup would normally include signs such as slowing downside momentum, a completed corrective pattern, a bullish reversal sequence, or an impulsive move away from support.
Why This Area Deserves Attention
A market approaching major support after a large corrective decline can create an important risk-versus-reward area. However, confirmation remains essential. The support zone identifies where a reversal may develop; it does not guarantee that the market will reverse immediately.
What Could Happen After Wave (II) Completes?
If wave (II) completes within or near the projected support area, the next expectation would be for a recovery to begin. At a minimum, a completed higher-degree correction could produce a three-wave rebound. A stronger bullish development could eventually become the beginning of a new impulsive sequence.
The first sign of improvement would not simply be price touching the support zone. Traders would generally look for a meaningful reaction from the area, followed by a sequence of higher lows and higher highs on lower time frames. An impulsive advance away from support would provide stronger evidence that the corrective phase has ended.
Bullish Scenario
The bullish scenario becomes more attractive if price reaches the projected support region, completes the expected corrective structure, and then begins an impulsive recovery. In that case, the market could attempt to retrace a meaningful portion of the decline from the $38.13 peak.
Risk Scenario
A support zone should never be treated as guaranteed. If price fails to stabilize and continues to break lower without producing a convincing reversal structure, the corrective phase may be deeper or more complex than initially expected. The $6.13 level remains the major long-term reference point for the broader wave interpretation.
What Should Traders Watch for Near Support?
The most useful approach is to combine the projected Elliott Wave zone with actual price confirmation. Rather than assuming that the first touch of support marks the final low, market participants can monitor how price behaves as it approaches and trades within the region.
- A visible slowdown in bearish momentum as price enters support.
- Completion of the expected corrective wave structure.
- A strong bullish reaction or impulsive move away from the support area.
- Development of higher lows after the initial reversal attempt.
- Recovery above nearby resistance levels that previously capped price.
These signals can help distinguish a genuine reversal attempt from a temporary bounce inside an ongoing downtrend.
Final PSLV Weekly Outlook
The weekly Elliott Wave structure suggests that the strong advance from the August 2022 low completed a higher-degree wave (I) at $38.13. The decline that followed is being tracked as a potential wave (II) correction developing through a w-x-y structure.
The main technical focus is now the $12.79 to $16.27 support zone. This region may provide the setting for the current correction to mature, but price confirmation will remain necessary before a durable low can be assumed.
If the corrective structure completes and buyers regain control, the market could begin at least a three-wave recovery, with the possibility of a larger bullish continuation developing over time. Until then, the support zone and the quality of the reaction from it remain the most important factors to monitor.