
- August 15, 2026
- Posted by: Alira Iluka
- Category: News
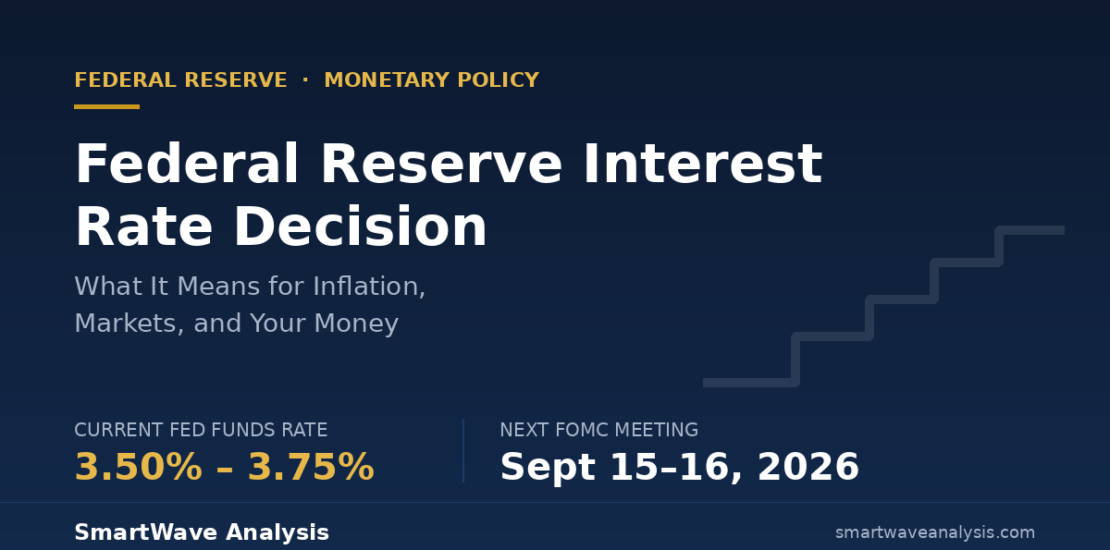
Every six to seven weeks, a group of twelve people in Washington, D.C. makes a decision that ripples through mortgage rates, credit card bills, stock prices, and the value of the dollar in your pocket. That group is the Federal Open Market Committee, and its interest rate decision is arguably the single most-watched economic event in the world.
As of August 2026, the Federal Reserve is holding its benchmark rate at 3.50%–3.75%, inflation is still running above the Fed’s target, and a new Fed Chair is about to give his first major policy speech at the Jackson Hole Economic Policy Symposium — with a fresh interest rate decision arriving three weeks later. Here’s a complete, plain-English breakdown of how the Fed actually works, what today’s data says, and what to watch next.
What Is the Federal Reserve and Why Does It Control Interest Rates?
The Federal Reserve is the central bank of the United States. Congress created it in 1913, and it operates under what’s called a dual mandate: keep prices stable and support maximum employment. In practice, this means the Fed is constantly trying to balance two goals that don’t always point in the same direction — cooling inflation without choking off jobs and economic growth.
The Fed’s main lever for doing this is the federal funds rate, the interest rate banks charge each other for overnight loans. It sounds narrow, but this single rate sets the tone for nearly every other borrowing cost in the economy — mortgages, auto loans, credit cards, business financing, and savings account yields all move in relation to it.
The actual rate-setting body is the Federal Open Market Committee (FOMC), made up of the seven members of the Federal Reserve Board plus five of the twelve regional Reserve Bank presidents on a rotating basis. The FOMC meets eight times a year, roughly every six to seven weeks, to review incoming data and vote on monetary policy.
How an Interest Rate Decision Actually Gets Made
Each FOMC meeting follows a fairly consistent rhythm. Committee members walk in with weeks of economic data — inflation readings, labor market numbers, consumer spending trends, and global risk factors — and debate whether the current policy stance is too tight, too loose, or about right.
Four of the eight meetings each year (typically March, June, September, and December) include an updated Summary of Economic Projections, better known as the “dot plot,” which shows where each member expects rates to land over the next few years. These meetings tend to move markets more than the other four, since they offer the clearest forward guidance on the Fed’s policy outlook.
At 2:00 p.m. Eastern on the second day of each meeting, the Fed releases a short policy statement announcing whether it’s decided on a rate hike, a rate cut, or a rate hold. Thirty minutes later, the Chair holds a press conference to explain the reasoning and field questions — this is often where markets react most sharply, since a single phrase can shift interest rate expectations for months.
CPI, Core CPI, PPI, and PCE: Why the Fed Doesn’t Just Watch One Number
This is where a lot of coverage oversimplifies things. The Fed doesn’t rely on a single inflation figure — it weighs several, because each one measures something slightly different.
Consumer Price Index (CPI) tracks the price of a fixed basket of goods and services that a typical urban household buys — everything from groceries to rent to plane tickets. It’s released monthly by the Bureau of Labor Statistics and gets the most media attention because it’s the number that shows up in headlines first.
Core CPI strips out food and energy prices, which swing wildly month to month for reasons that have little to do with underlying economic conditions — a hurricane spiking gas prices doesn’t tell you much about broader inflation pressure. Core CPI is generally seen as a cleaner read on inflation persistence.
Producer Price Index (PPI) and core PPI measure price changes from the seller’s side — what businesses charge wholesale, before goods reach consumers. Because producer costs often show up in consumer prices a month or two later, PPI can act as an early signal of where CPI is headed.
Personal Consumption Expenditures Price Index (PCE), and specifically core PCE inflation, is the Fed’s actual preferred gauge for judging progress toward its 2% target. PCE differs from CPI in a few technical but important ways: it uses chain-weighting that adjusts for how consumers substitute between goods as prices shift, it covers a broader range of spending (including costs paid on someone’s behalf, like employer-sponsored health insurance), and it weights shelter and healthcare differently than CPI does. That’s why CPI and PCE readings sometimes tell slightly different stories in the same month — and why financial media quoting only CPI can miss what the Fed is actually watching.
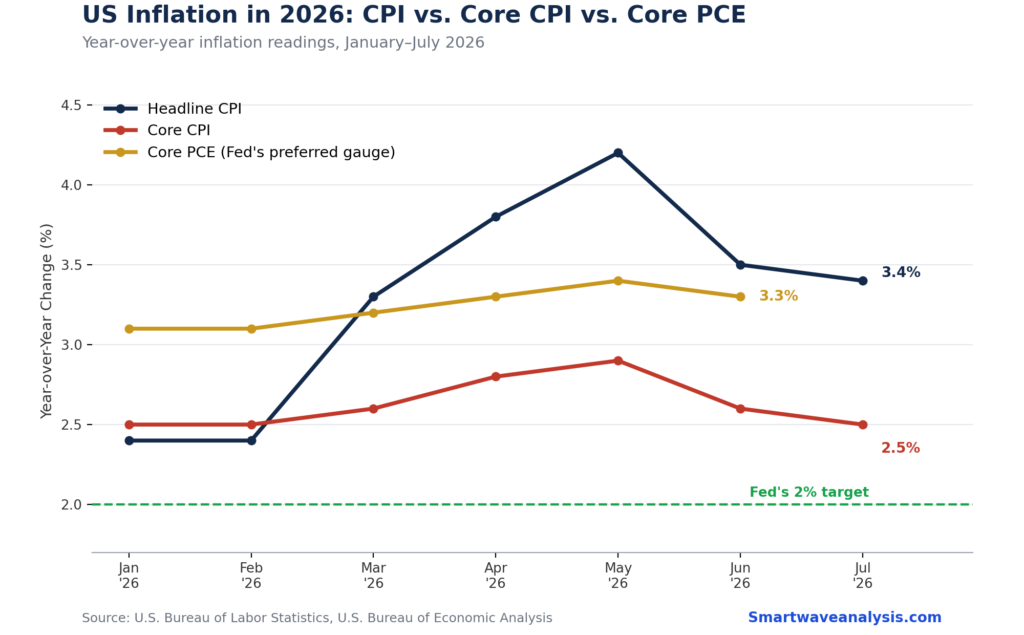
As of the most recent readings, headline CPI sat at 3.4% year-over-year with core CPI at 2.5%, while core PCE — the Fed’s preferred underlying inflation measure — was running around 3.3%. Both remain above the Fed’s 2% price stability target, which is the central reason the Fed has held rates steady rather than moving toward rate cuts.
🚀 Don’t Miss the Next Move
Get daily Elliott Wave counts, live chart updates, and high-probability trade setups across crypto, forex, and stocks — before the market moves.
👉 Start Your 14-Day Trial for Just $0.99 →Cancel anytime. No long-term commitment. (Affiliate link — we may earn a commission at no extra cost to you.)
Where Things Stand Right Now
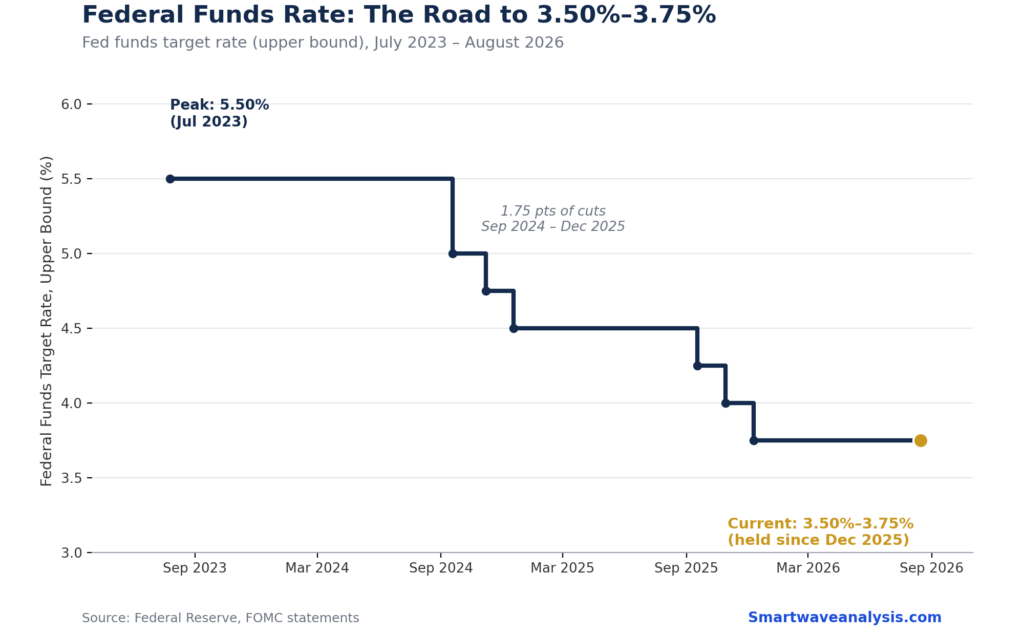
The Fed held its benchmark rate at 3.50%–3.75% at its July 2026 meeting, extending a pause that’s persisted for most of the year. Unlike the unanimous vote in June, three committee members dissented in July, preferring a quarter-point hike — a sign that internal disagreement over the appropriate policy stance has grown more visible.
This meeting was also notable because it was the first held under new Fed Chair Kevin Warsh, who was sworn in during May 2026. Early signals suggest a more hawkish policy communication style than his predecessor, with a greater emphasis on inflation vigilance even as some officials push for easing given signs of labor market softening.
The tension boils down to this: inflation, while off its highs, is cooling more slowly than the Fed would like, and monetary tightening carries real economic costs the longer it drags on. That’s the core dilemma behind every interest rate decision this year.
Rate Hike vs. Rate Cut vs. Rate Hold: What Each Means for You
- A rate hike raises borrowing costs across the board. Mortgage rates, auto loans, and credit card APRs tend to climb, which is designed to cool consumer demand and slow inflation pressure — but it also raises the cost of running a household or a business.
- A rate cut lowers borrowing costs, encouraging spending and investment. It tends to support economic growth and stock market valuations but can reignite inflation pressure if cut too aggressively or too soon.
- A rate hold — the Fed’s current stance — keeps existing conditions in place while officials gather more data. It signals a “wait and see” approach rather than a firm commitment in either direction, and it’s often the most common outcome across a full year of meetings.
For everyday finances, this shows up directly: credit card interest rates track the fed funds rate closely, so a hold generally means your APR isn’t dropping soon. Savings account and CD yields tend to follow the same pattern, which is part of why savers have benefited from the higher-rate environment even as borrowers have felt squeezed.
How Rate Decisions Ripple Through Bond Yields and Financial Markets
The federal funds rate directly influences short-term rates, but its effect on longer-term Treasury yields is more about expectations than mechanics. When the Fed signals it plans to hold rates higher for longer, longer-dated Treasury yields tend to rise as investors demand more compensation for tying up money over time. When cuts look likely, yields tend to fall in anticipation, often before the Fed actually moves.
This relationship between short and long-term rates forms the yield curve, a key gauge of financial conditions and one of the more closely watched signals of investor sentiment about future growth and inflation. An unusually flat or inverted yield curve — where short-term yields exceed long-term ones — has historically preceded economic slowdowns, though it’s an imperfect predictor.
Markets attempt to price in the Fed’s next move well before it happens, using futures contracts tied to the federal funds rate. This market pricing of interest rate expectations is why stocks and bonds sometimes react more to a change in the odds of a future cut than to an actual policy announcement — the announcement itself may already be priced in.
Jackson Hole and the September FOMC Meeting: What’s Coming Next
Two major events are set to shape the Fed’s policy outlook before the year is out.
The Jackson Hole Economic Policy Symposium, hosted annually by the Federal Reserve Bank of Kansas City, runs August 27–29, 2026. This year’s theme, “Financial Innovation: Implications for Payments and Policy,” centers on how digital payments and evolving financial technology are reshaping monetary policy transmission. The symposium matters well beyond its academic agenda because the Fed Chair’s Friday keynote has, in past years, moved markets sharply within a single trading session. This year’s speech, delivered by Chair Warsh on August 28, will be his first as head of the Fed — and with the September FOMC meeting landing just under three weeks later, it’s widely viewed as his last major opportunity to signal direction before that decision.
The Fed September meeting is scheduled for September 15–16, 2026, and — unlike July — it will include an updated dot plot and Summary of Economic Projections, giving the clearest read yet on where officials expect rates to head through 2027. With the August CPI report landing September 11, just days before the meeting, this stretch of the calendar is shaping up as one of the more consequential windows of the year for anyone tracking Fed interest rates, inflation trajectory, and where borrowing costs go next.
What Else Moves the Fed’s Decision: Labor Market, Growth, and Spending
Inflation data dominates headlines, but the Fed’s dual mandate means labor market health carries equal weight in its decisions. Unemployment trends, job creation numbers, and wage growth all factor into whether officials lean toward tightening or easing. A labor market that’s cooling too quickly can push the Fed toward cuts even if inflation hasn’t fully returned to target — which is part of the current internal debate at the FOMC.
Consumer spending and consumer demand matter too, since they make up the majority of U.S. economic activity. When spending holds up despite high rates, it gives the Fed more room to stay restrictive without fear of triggering a downturn. When spending softens alongside a weakening job market, pressure builds for the Fed to shift its policy stance faster than inflation data alone might suggest.
Frequently Asked Questions
What is the current federal funds rate? As of the July 2026 FOMC meeting, the federal funds target range is 3.50% to 3.75%, unchanged since the Fed’s pause earlier in the year.
When is the next Fed meeting? The next FOMC meeting is September 15–16, 2026. It will include an updated dot plot, making it one of the more closely watched meetings of the year.
Does the Fed pay more attention to CPI or PCE? The Fed’s official inflation target is based on the PCE Price Index, specifically core PCE, which excludes food and energy. CPI gets more media coverage because it’s released earlier each month, but PCE is the number Fed officials weigh most heavily in their own decisions.
What happens to mortgage rates when the Fed cuts rates? Mortgage rates don’t move in lockstep with the federal funds rate, since they’re priced off longer-term Treasury yields and investor expectations. That said, a sustained cutting cycle generally puts downward pressure on mortgage rates over time, especially once markets are confident cuts will continue.
Why does inflation matter more than just rising prices? Persistent inflation erodes purchasing power over time and creates economic uncertainty that complicates both household budgeting and business investment decisions. The Fed’s 2% target reflects a level considered consistent with healthy, predictable economic growth — not zero inflation, which carries its own risks.
What is forward guidance? Forward guidance refers to the Fed’s communication about its likely future policy path, delivered through statements, press conferences, and speeches like the one at Jackson Hole. It’s a deliberate tool the Fed uses to shape market expectations and financial conditions even between actual rate decisions.
This article is for informational and educational purposes only and does not constitute financial advice. Interest rate and inflation data are subject to revision; always confirm the latest figures via the Federal Reserve, Bureau of Labor Statistics, and Bureau of Economic Analysis before making financial decisions.