
- August 7, 2026
- Posted by: Alira Iluka
- Category: News
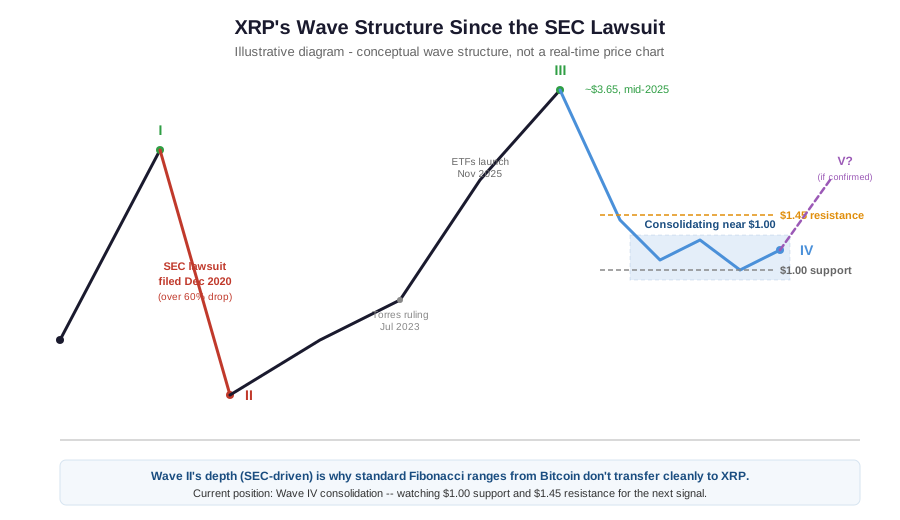
Quick answer: Unlikely from current levels. XRP’s chart is behaving like a market working through a correction, not building toward an impulsive breakout, and the capital that would typically confirm a bigger move — fresh ETF inflows — hasn’t shown up at the scale forecasters expected.
Key Takeaways
- XRP’s current price action near $1.00 looks, on the chart, like a Wave IV-style consolidation — not the setup that typically precedes a 10x-plus move.
- XRP’s wave structure carries a scar no other major crypto has: a legally-triggered crash from the 2020 SEC lawsuit that behaved like an unusually deep Wave II, over 60% in days.
- XRP spot ETFs have pulled in roughly $1.5 billion since their November 2025 launch — a fraction of the $4–8.4 billion Wall Street forecast, and the kind of capital flow that normally fuels a Wave III impulse, not what’s happened here.
- At a ~$64 billion market cap, XRP would need hundreds of billions in fresh capital to multiply the way early buyers of true micro-cap assets do.
- None of this rules out a big move eventually — but the setup right now looks like patience, not a rocket.
Open XRP’s weekly chart right now and one thing stands out immediately: price has been grinding sideways near $1.00 for weeks, well off the $3.65 high it touched in the summer of 2025. That’s not unusual after a sharp rally — but it raises the question a lot of holders are quietly asking. Is this a pause before the next leg up, or is the “millionaire-maker” story already over?
Reading that question through price structure, rather than headlines, gives a clearer answer than most coverage offers.
Reading XRP’s Wave Structure Since the SEC Lawsuit
XRP’s chart has a scar that Bitcoin’s and Ethereum’s don’t. In December 2020, the SEC filed suit against Ripple, alleging the company had raised $1.3 billion through an unregistered securities offering. XRP’s price didn’t just dip on the news — it collapsed more than 60% within days. In Elliott Wave terms, that’s not a typical Wave II correction driven by profit-taking. It’s a legally forced, liquidity-driven crash that behaved like an unusually deep retracement, and it set the tone for every wave that followed.
Quick answer: Because XRP’s steepest historical decline was triggered by a legal event rather than normal market rotation, the Fibonacci ranges that work well on Bitcoin’s chart don’t transfer cleanly. XRP’s corrections have tended to run deeper, and its invalidation levels sit in different places than a “standard” wave count would suggest.
The lawsuit dragged on for nearly five years. Judge Analisa Torres’s July 2023 ruling — that XRP sold on public exchanges wasn’t a securities transaction — marked the structural turning point, even though the case wasn’t fully closed until 2025. That multi-year overhang is part of why XRP’s advance out of its bear-market lows looks choppier and more corrective than Bitcoin’s cleaner five-wave recoveries over the same period.
There’s a second, smaller factor shaping the count: escrow supply. Ripple releases up to 1 billion XRP monthly from escrow, though it historically re-locks most of that. It’s a manageable, predictable flow — but during a Wave IV-style consolidation like the current one, it adds a small extra headwind that Bitcoin’s fixed-supply chart never has to price in.
Our XRP Elliott Wave page tracks this structure daily, with Fibonacci levels adjusted for XRP’s lawsuit-distorted history rather than borrowed from a Bitcoin template.
What the Current Consolidation Near $1.00 Actually Looks Like
Since topping near $3.65 in mid-2025, XRP’s decline into the $1.00–$1.05 zone has unfolded in a way that reads more like a corrective structure working itself out than a trend reversal. Price is roughly 73% off its January 2018 all-time high of $3.84, and well off 2025’s peak — but it’s also holding a round-number support level that’s attracted repeated buying interest over the past several weeks.
Quick answer: A grinding, sideways consolidation near a well-watched support level is typical Wave IV behavior — a market resetting before it can attempt another impulsive leg, not confirmation that the trend is over.
What would change that read? A confirmed break and close below $1.00 on rising volume would be the first sign the correction is deeper than a standard Wave IV. On the other side, a sharp, high-volume reclaim of the $1.45 resistance that’s capped rallies since February would be the stronger signal that a new impulsive wave — the kind that actually produces outsized gains — is underway. Until one of those happens, the honest technical read is: this is a market in a holding pattern, not one building toward a breakout.
Why the ETF Inflow Numbers Matter for the Wave Count
Here’s where the fundamental picture and the technical picture connect, and it’s the part most “should I buy XRP” articles skip entirely: a genuine Wave III impulse needs fuel, and that fuel is usually fresh capital.
XRP spot ETFs launched in November 2025 and had crossed $1 billion in cumulative inflows by mid-December — an encouraging start. But the pace didn’t hold. As of mid-2026, cumulative inflows sit around $1.5 billion, against forecasts of $4–8.4 billion from both JPMorgan and Standard Chartered for the first year alone. Standard Chartered has already cut its 2026 XRP price target from $8 down to $2.80 as a direct result.
| Forecast Source | First-Year Inflow Estimate | Actual (Mid-2026) |
|---|---|---|
| JPMorgan | $4.0 – $8.4 billion | ~$1.5 billion |
| Standard Chartered | $4.0 – $8.0 billion | ~$1.5 billion |
That shortfall matters technically, not just financially. Roughly 84% of the inflows that did arrive came from retail investors — the larger institutional wave that pushed Bitcoin’s ETFs past $108 billion hasn’t shown up for XRP yet. Much of it is reportedly waiting on the CLARITY Act, proposed legislation that would give large asset managers a clearer legal basis to hold XRP at scale. There’s one notable exception worth flagging: Goldman Sachs disclosed a $153.8 million position in spot XRP ETFs via a Q1 2026 13F filing, the largest known institutional XRP ETF holding in the U.S. It’s a real signal — just not yet the scale that would typically power a Wave III.
For the full inflow breakdown straight from the source, Ripple publishes its own ETF and institutional adoption data.
The Market Cap Math Behind “Millionaire-Maker”
Set the chart aside for a moment and look at the raw numbers, because they explain why this setup is different from a true early-stage “millionaire-maker” asset.
XRP has roughly 62.5 billion tokens in circulation and a market cap near $64 billion — sixth-largest among all cryptocurrencies. Since market cap is just price multiplied by supply, every price target implies a specific amount of new capital that has to show up.
| XRP Price Target | Implied Market Cap | Multiple of Today |
|---|---|---|
| $1.00 (current) | ~$62.5 billion | 1x |
| $3.84 (prior all-time high) | ~$240 billion | ~3.8x |
| $10.00 | ~$625 billion | ~10x |
| $50.00 | ~$3.1 trillion | ~50x |
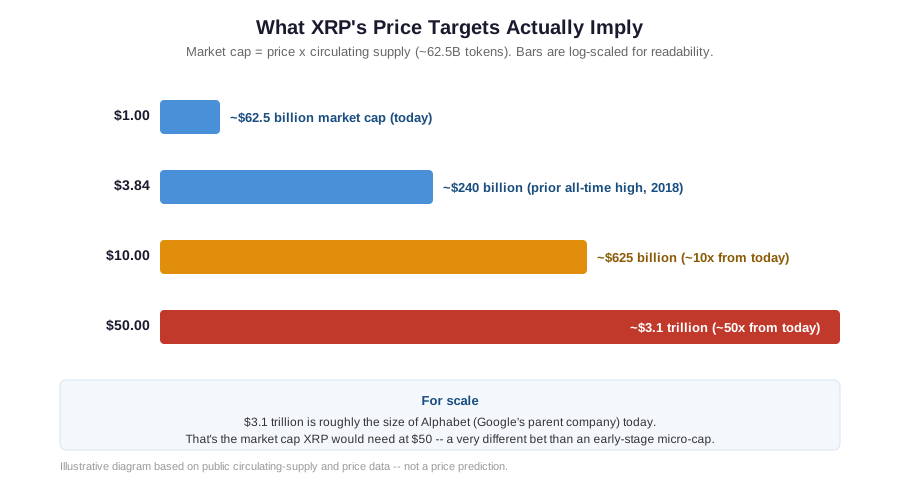
A $3.1 trillion market cap is roughly the size of Alphabet (Google’s parent company) today. That’s not a knock on XRP specifically — it’s simply the math of a $60 billion-plus asset. A true “10-bagger” story is far easier to find in a $10 million token than a $64 billion one, because the same dollar of new demand moves the smaller asset’s price much further.
XRP vs. a True Early-Stage “Millionaire-Maker” Asset
| Trait | Typical Early-Stage Asset | XRP Today |
|---|---|---|
| Starting market cap | Under $50 million | ~$64 billion |
| Regulatory status | Often unresolved | Fully resolved (2025 settlement) |
| Biggest catalyst | Usually still ahead | Largely already priced in |
| Capital needed for 10x | Relatively small | Hundreds of billions |
| Wave position (typical) | Early impulse | Corrective consolidation |
🚀 Don’t Miss the Next Move
Get daily Elliott Wave counts, live chart updates, and high-probability trade setups across crypto, forex, and stocks — before the market moves.
👉 Start Your 14-Day Trial for Just $0.99 →Cancel anytime. No long-term commitment. (Affiliate link — we may earn a commission at no extra cost to you.)
Common Mistakes Traders Make Reading This Setup
- Confusing “catalyst approved” with “catalyst ahead.” The ETF launch and lawsuit resolution already happened — the anticipation-driven rally into those events is what’s over, not necessarily XRP’s entire cycle.
- Applying Bitcoin’s Fibonacci levels directly to XRP. XRP’s legally-driven Wave II crash means its corrections and invalidation levels don’t sit where a standard model would place them.
- Reading sideways price action as automatically bearish. A Wave IV consolidation is a normal, necessary part of a larger structure — not a verdict on the asset.
- Ignoring market cap when chasing a price target. A “10x” headline means something very different at a $10 million valuation than at a $64 billion one.
- Trading without a defined invalidation level. In a grinding, range-bound market like this one, an undefined stop is more dangerous than in a trending one.
Frequently Asked Questions
Is XRP in an uptrend or a downtrend right now?
Neither cleanly. Price is consolidating near $1.00 after a sharp decline from 2025 highs, which technically reads as a corrective (Wave IV-style) structure rather than a confirmed trend in either direction.
What would confirm XRP is starting a new impulsive move higher?
A high-volume break and close back above the $1.45 resistance that’s capped rallies since February would be the stronger technical signal, alongside a pickup in ETF inflows.
What would suggest the correction is deeper than expected?
A confirmed close below the $1.00 support level on rising volume would be the first warning sign that the current structure needs to be reassessed.
Why doesn’t Bitcoin’s Elliott Wave model work well for XRP?
XRP’s price history includes a legally-triggered crash (the 2020 SEC lawsuit) that behaved like an unusually deep Wave II, plus a unique monthly escrow release schedule. Both distort standard Fibonacci ranges that assume a “normal” corrective pattern.
How much have XRP ETFs actually raised so far?
Roughly $1.5 billion in cumulative inflows as of mid-2026, well below the $4–8.4 billion first-year forecast from both JPMorgan and Standard Chartered.
Is XRP still legally at risk because of the SEC case?
No. The case was fully resolved in 2025, with a reduced penalty and the SEC dropping its appeal. XRP is not classified as a security for secondary market or exchange trading.
What is the CLARITY Act and why does it matter here?
It’s proposed U.S. legislation that would give XRP clearer legal standing for large institutional holders like pension funds and insurers. Its passage is seen as a potential trigger for the bigger wave of institutional capital that hasn’t arrived yet.
What price would XRP need to hit to make a $10,000 investment worth $1 million?
That’s a 100x gain, which at XRP’s current ~$64 billion market cap would imply a market cap larger than nearly every public company that exists today.
Are any large institutions actually buying XRP ETFs?
Yes, though modestly so far. Goldman Sachs disclosed a $153.8 million position via a Q1 2026 13F filing — currently the largest known institutional XRP ETF holding in the U.S.
How does XRP’s escrow system affect its price?
Ripple releases up to 1 billion XRP monthly from escrow, though it historically re-locks the majority of each release. The resulting flow adds modest, fairly predictable selling pressure rather than sudden supply shocks.
Should I buy XRP right now?
That depends on your own risk tolerance and time horizon, not a generic answer. If you’re considering it, defining your invalidation level and position size in advance matters more than reacting to the current price alone.
Can I trade XRP with futures instead of buying spot?
Yes. XRP futures launched on CME Group alongside the broader wave of institutional XRP products in late 2025, giving traders a regulated way to take both long and short positions.
Final Takeaway
XRP’s story has real substance — a resolved lawsuit, a legal precedent, and genuine ETF access. But the chart right now is telling a more cautious story than the headlines: this looks like a market consolidating, waiting on either a confirmed breakdown or a confirmed breakout, not one already mid-flight toward a 10x move.
Track the live structure on our XRP Elliott Wave page, updated daily with Fibonacci levels adjusted for XRP’s specific history. New to reading corrective structures like this one? Our Elliott Wave Theory for Beginners guide is a free starting point, and our Elliott Wave Trading Blueprint eBook walks through the full framework — no sign-up required.
This article is for educational purposes only and is not financial advice. Cryptocurrency investments carry substantial risk of loss, including total loss of principal.