
- July 15, 2026
- Posted by: George
- Category: News
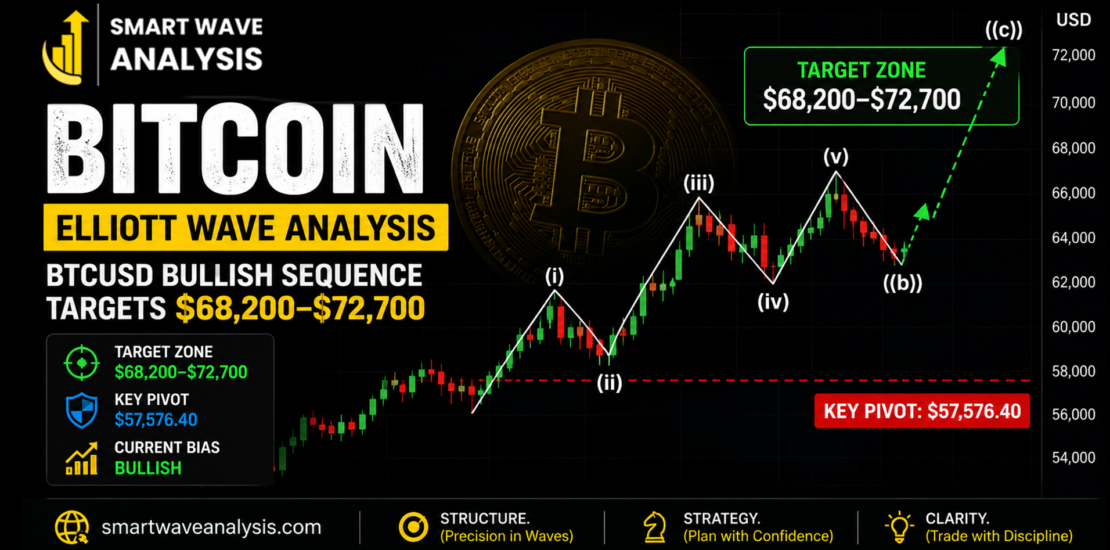
BTCUSD · Elliott Wave Research Note
Bitcoin’s price action since late June has followed a textbook Elliott Wave sequence, and that structure is now pointing toward a specific target zone rather than an open-ended guess.
Quick answer
Bitcoin’s short-term wave structure has stayed bullish since the June 25, 2026 low. The rally completed a five-wave advance into wave ((a)) at $64,735, corrected in an expanded flat that bottomed at $61,286.25, and then pushed back above the wave ((a)) high — the technical signal that wave ((c)) is underway. Projecting a Fibonacci extension from that structure puts the next target zone at $68,200 to $72,700, and the setup stays intact as long as Bitcoin holds above the $57,576.40 pivot.
Reading a wave count correctly means more than labeling swings on a chart. It means understanding why a five-wave advance behaves differently from a three-wave correction, why certain price levels act as hard invalidation points, and why a projected target zone is a probability rather than a promise. This analysis walks through the current BTCUSD structure in detail, explains the Elliott Wave concepts behind it in plain language, and covers what would need to happen for the bullish case to break down.
What Elliott Wave Theory Actually Measures
Ralph Nelson Elliott developed this framework in the 1930s after noticing that financial markets tend to move in repeating patterns: five waves in the direction of the larger trend, followed by three waves against it. Every completed price swing gets classified as one type or the other, and that classification is what allows an analyst to project where the next swing is likely to end.
Impulse waves versus corrective waves
An impulse wave is a five-wave sequence, labeled 1 through 5, that moves with the dominant trend. Waves 1, 3, and 5 push in the trend’s direction, while waves 2 and 4 pull back without fully retracing the wave before them. A corrective wave, labeled A-B-C, moves against the trend and can take several different shapes: a simple zigzag, a sideways flat, or a more complex combination of the two. Bitcoin’s rally from the June 25 low is a textbook impulse, and it’s the internal shape of that impulse, five clean legs, that gives the current bullish reading its structural support.
Why Fibonacci ratios matter inside a wave count
Elliott Wave analysis rarely stands on its own. It’s almost always paired with Fibonacci retracement and extension ratios to estimate how far a wave is likely to travel. Corrective waves tend to retrace 38.2%, 50%, or 61.8% of the wave before them, while impulse waves often extend to 100% or 161.8% of an earlier leg in the same sequence. Applying those ratios to Bitcoin’s current structure is what produces the $68,200–$72,700 projection covered below.
Bitcoin’s Current Wave Structure, From the June 25 Low to Today
The rally began at the June 25, 2026 low and unfolded across five identifiable legs before running into its first meaningful resistance.
The five-wave advance into wave ((a))
Wave (i) carried price to $60,930 before corrective wave (ii) pulled the market back to $57,600, a retracement that stayed within normal Fibonacci bounds and never threatened the emerging uptrend. Wave (iii), typically the strongest leg in an impulse, extended to $64,017. A shallow wave (iv) correction followed, bottoming at $61,047.53, and the final wave (v) pushed to $64,735. That five-wave sequence completed the higher-degree wave ((a)).
Wave ((b)): an expanded flat correction
After wave ((a)) topped, Bitcoin corrected in wave ((b)), which unfolded as what Elliott Wave analysts call an expanded flat. In a standard flat correction, wave B retraces close to the starting point of wave A, and wave C ends near the same level as wave A’s low. An expanded flat is a variation where wave B moves beyond the start of wave A, creating a new high or low outside the prior wave’s range, before wave C reverses and travels further than a standard flat typically would. That’s the pattern that played out here, with wave ((b)) bottoming at $61,286.25.
Confirmation: Bitcoin reclaims the wave ((a)) high
The detail that matters most for the current outlook is what happened after wave ((b)) ended. Price moved back above the wave ((a)) high at $64,735, and in Elliott Wave terms, that’s a meaningful signal. A genuine corrective wave shouldn’t be followed by a new high if the larger trend has actually turned down. Reclaiming that level is the technical basis for treating wave ((c)) as already underway, rather than treating the recent low as the start of a deeper decline.
The Bitcoin Price Target Explained: Why $68,200–$72,700 Is the Zone to Watch
Once wave ((b)) is confirmed complete, the next step is projecting where wave ((c)) is likely to end. That projection uses a Fibonacci extension of wave ((a)), measured from the low of wave ((b)). Extending wave ((a)) by 100% to 161.8% from that point produces a target range of $68,200 to $72,700, the zone where wave ((c)) is expected to encounter its first serious resistance.
It’s worth being precise about what a target zone actually represents. It isn’t a price Bitcoin is guaranteed to reach, and it isn’t a level where a reversal is certain the moment price touches it. It’s the area where, historically, wave ((c)) legs of similar internal structure have tended to complete, which makes it the zone where sellers are statistically more likely to step back in, not a guaranteed ceiling.
| Wave | Price Level | What It Represents |
|---|---|---|
| Wave (i) | $60,930 | End of the first impulse leg |
| Wave (ii) | $57,600 | Corrective pullback within the impulse |
| Wave (iii) | $64,017 | Strongest leg of the advance |
| Wave (iv) | $61,047.53 | Fourth-wave correction |
| Wave (v) / Wave ((a)) | $64,735 | Completion of the five-wave advance |
| Wave ((b)) | $61,286.25 | Low of the expanded flat correction |
| Key pivot | $57,576.40 | Level that would invalidate the bullish structure |
| Target zone | $68,200–$72,700 | Projected completion area for wave ((c)) |
What Would Invalidate the Bullish Bitcoin Outlook
Every Elliott Wave count needs a level that proves it wrong, and for this structure, that level is $57,576.40 — a support pivot that has held since wave (ii) of the advance. As long as Bitcoin holds above it, pullbacks are treated as corrective dips within the larger bullish sequence rather than the start of a new decline.
Bullish Scenario
Bitcoin holds above $57,576.40 and pullbacks continue to unfold as three- or seven-swing corrections.
Potential outcome: Wave ((c)) extends toward the $68,200–$72,700 target zone.
Alternative Scenario
Bitcoin loses the $57,576.40 pivot on a sustained basis and fails to reclaim it.
Potential outcome: The short-term count needs reworking, often in favor of a more complex correction or a deeper retracement toward the wave (iv) region.
A break below the pivot wouldn’t necessarily mean Bitcoin’s broader uptrend is finished. It would mean the specific short-term count driving the $68,200–$72,700 projection needs to be reworked. The distinction between “the trend changed” and “this particular wave count needs revising” gets lost in a lot of retail technical analysis, and it’s worth keeping the two separate.
Three-Swing vs. Seven-Swing Corrections: Reading Bitcoin’s Pullbacks
One detail that trips up a lot of traders following wave counts is the idea that a correction can unfold in three swings or seven swings, and it’s worth explaining the difference plainly.
Simple corrections: the three-swing zigzag
A three-swing correction is a single A-B-C move completed in one clean pass. It’s the simplest corrective shape in Elliott Wave theory and usually the fastest to play out.
Complex corrections: the seven-swing combination
A seven-swing correction is what analysts call a combination: two corrective patterns joined by a connecting wave, labeled W-X-Y. It takes longer to complete and looks messier on a chart, but it doesn’t change the underlying bullish read as long as price stays above the pivot. For Bitcoin’s current pullbacks, either outcome keeps the wave ((c)) target intact. The practical takeaway is that a slow, choppy pullback isn’t automatically a warning sign.
A quick way to tell them apart while it’s happening
Watch the clock more than the chart shape. A three-swing zigzag rarely takes longer to complete than the impulse wave that came before it. A seven-swing combination typically drags on well past that timeframe, which is often the first clue traders are dealing with the more complex version.
Elliott Wave Analysis Compared With Other Bitcoin Technical Tools
Elliott Wave theory works best as one input among several, not a standalone signal. Here’s how it stacks up against the indicators most Bitcoin traders already use.
| Tool | What It’s Best At | Where It Falls Short |
|---|---|---|
| Elliott Wave Theory | Projecting target zones and invalidation levels from structure | Subjective — two analysts can label the same chart differently |
| Moving Averages | Confirming the direction of the broader trend | Lagging, since it reacts to price rather than anticipating it |
| RSI | Flagging overbought or oversold conditions | Can stay extended for long stretches in strong trends |
| MACD | Spotting momentum shifts and divergences | Prone to false signals in choppy, range-bound markets |
| Volume Profile | Identifying where real buying and selling interest sits | Doesn’t project future price targets on its own |
Why pairing indicators matters near a target zone
Watching for RSI divergence or unusual volume as Bitcoin approaches $68,200 gives a more complete picture than relying on the wave count alone. A wave target says where price might react. A momentum or volume signal helps confirm whether it actually is.
Common Mistakes Traders Make With Elliott Wave Counts
Forcing a bullish or bearish bias onto the chart instead of letting the structure dictate the count.
Ignoring the invalidation level once a trade is open, and holding a position long after the original thesis has broken.
Treating the target zone as a guaranteed exit price rather than an area to watch for reversal signals.
Overlooking that a valid alternate count almost always exists, and refusing to consider it once price action starts contradicting the preferred scenario.
Sizing positions as though the wave count carries near-certainty, when Elliott Wave analysis works probabilistically at best.
Putting This Bitcoin Elliott Wave Outlook Into Practice
Educational analysis, not financial advice
None of this is a recommendation to buy or sell Bitcoin at any specific level. It’s a framework for interpreting the structure already on the chart, and it should be treated as educational analysis rather than trading advice.
If the bullish scenario continues to play out, the pivot at $57,576.40 is the level that defines when the thesis breaks down, and the $68,200–$72,700 zone is where a shift in behavior, such as slowing momentum, a bearish divergence, or unusually heavy volume on the way in, becomes worth watching closely.
Any trader applying this outlook to their own strategy should factor in their own risk tolerance, timeframe, and existing exposure to Bitcoin, and treat the wave count as one input among several rather than the entire decision.
Frequently Asked Questions
QWhat is the current Elliott Wave count for Bitcoin (BTCUSD)?
Bitcoin is in a wave ((c)) advance following the completion of an expanded flat correction in wave ((b)) at $61,286.25. The structure remains bullish while price holds above the $57,576.40 pivot, with a projected target zone of $68,200 to $72,700.
QWhat is an expanded flat correction?
An expanded flat is a three-wave A-B-C correction where wave B moves beyond the starting point of wave A, and wave C then extends further than it would in a standard flat pattern. It’s one of several corrective shapes Elliott Wave theory recognizes alongside the simple zigzag.
QWhy is $57,576.40 considered the key level for Bitcoin right now?
That level has acted as a support pivot since wave (ii) of the advance. Holding above it keeps the current bullish wave count intact. A sustained close below it would require the structure to be reassessed.
QHow is the $68,200–$72,700 Bitcoin price target calculated?
The zone comes from a Fibonacci extension of wave ((a)), projected from the low of wave ((b)). The 100% to 161.8% extension range of that measurement produces the target area for wave ((c)).
QIs Elliott Wave analysis reliable for trading cryptocurrency?
Elliott Wave analysis is probabilistic rather than predictive. It can help identify likely target zones and clear invalidation levels, but wave counts get revised as new price data comes in, so it works best alongside other tools rather than as a standalone signal.
QWhat happens if Bitcoin doesn’t reach the $68,200–$72,700 target zone?
A wave ((c)) advance can end short of a projected target if selling pressure appears earlier than expected. That wouldn’t invalidate the broader bullish structure on its own. The pivot at $57,576.40, not the target zone, is what defines whether the count holds.
Bottom Line
Bitcoin’s short-term structure has stayed constructive since the June 25 low: a clean five-wave advance, a well-defined expanded flat correction, and a recovery back above the prior high that keeps the bullish case active. The $68,200–$72,700 zone is the area to watch for wave ((c))’s completion, and the $57,576.40 pivot remains the level that would force a rethink of the entire structure. As with any Elliott Wave outlook, the structure is a framework for probability, not a guarantee, and that pivot is doing more work in this analysis than the target zone is.